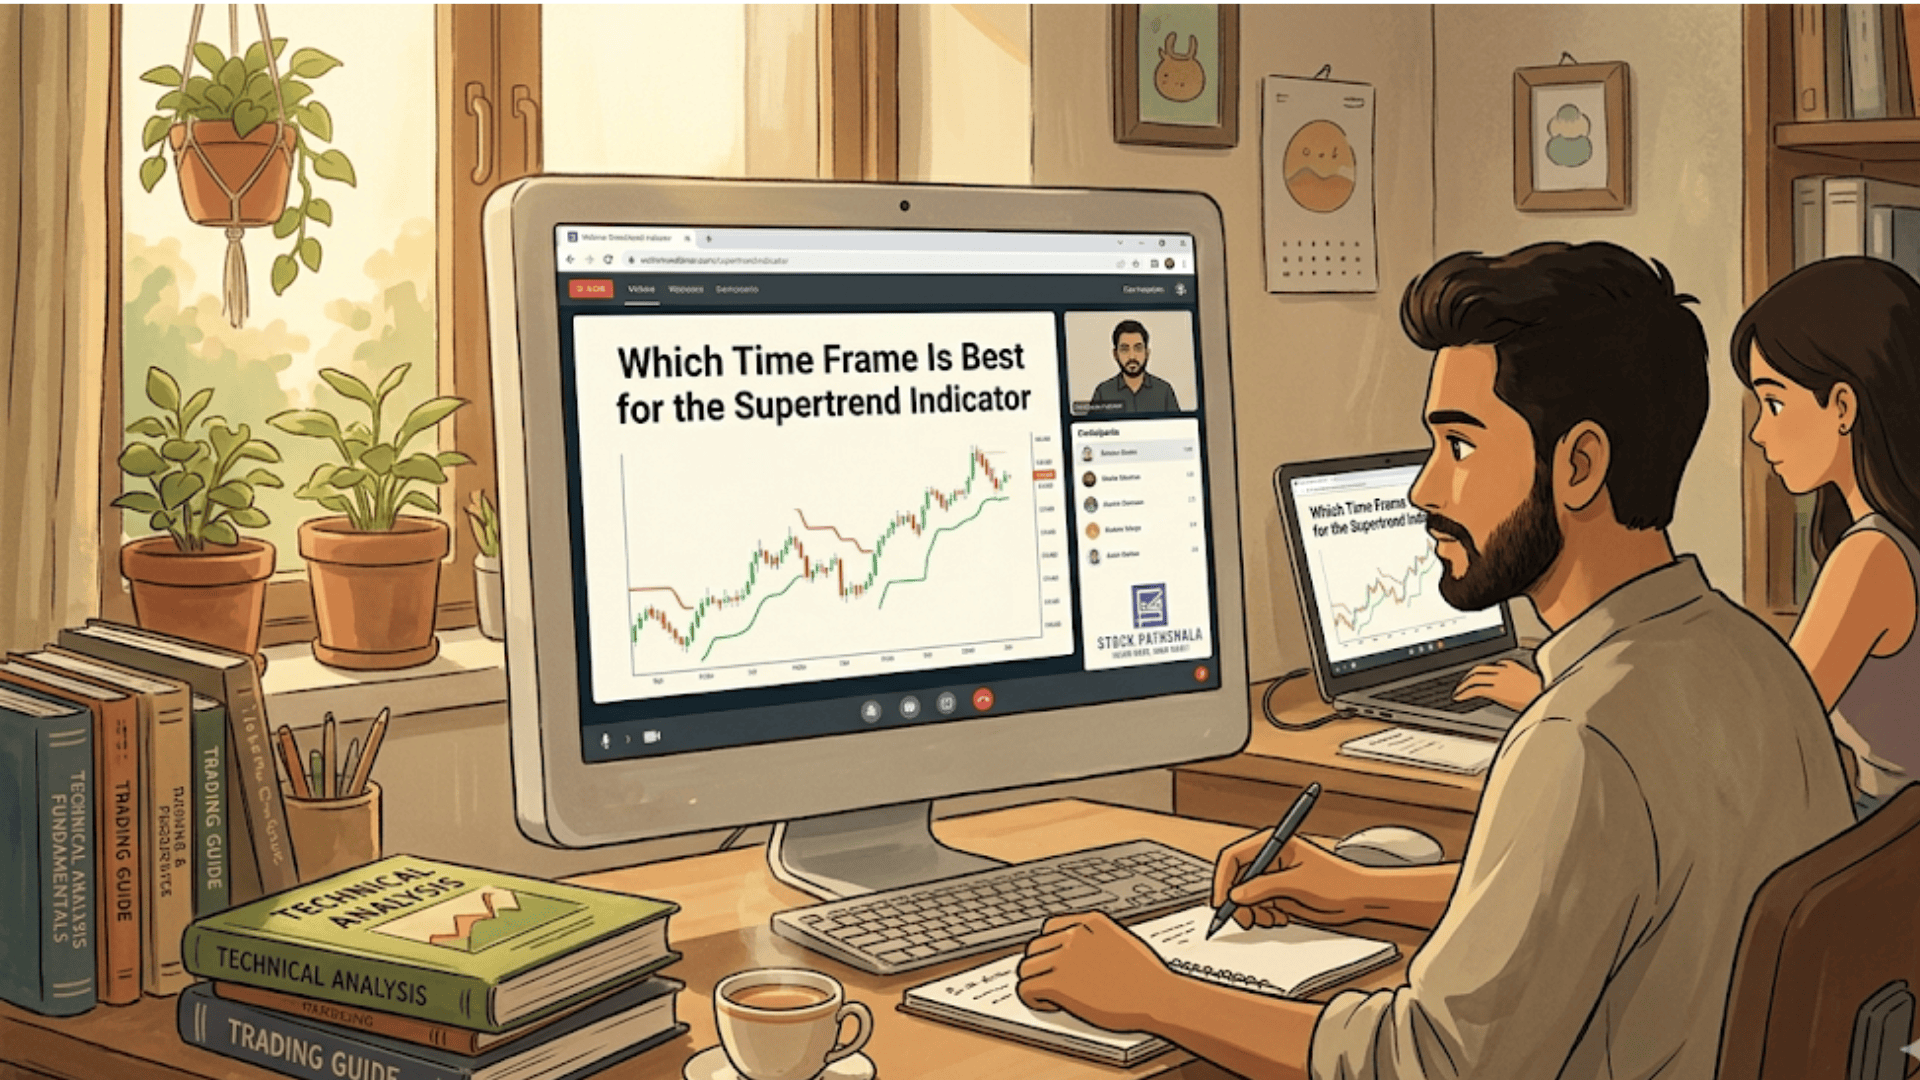
ટેક્નિકલ વિશ્લેષણ
શેર માર્કેટમાં એક બાજુ જ્યાં રોકણ કરવા માટે ફન્ડામેન્ટલ એનાલિસીસ કરવામાં આવે છે તો બીજી બાજુ શોર્ટ ટર્મ ટ્રેડ માટે ટેકનિકલ એનાલિસીસ કરવામાં આવે છે, જે ચાર્ટ, ઈન્ડીકેટર, પ્રાઈસ એક્શન પર આધારિત હોય છે. જો …
The king of all candlestick patterns, the hammer pattern is a bullish reversal pattern but how is it different from its sibling hanging man? In this article, we will be considering a few differences between …
There are many reversal signals formed by candlestick patterns. One such reversal pattern is three white soldiers, a three-candlestick pattern that indicates the end of a bearish market. But how to trade three white soldiers? …
Most of the time, you might have heard about using price action strategies to trade in stocks. But for that, it is important to understand candlestick patterns, its anatomy, and most importantly how to read …
A doji candlestick pattern is mostly a plus sign (+) sign but what does doji candle indicate? If it gives an indication of a bullish market, then how to trade the doji candlestick pattern? In …
The word doji has Japanese origins and means ‘same matter.’ It is generally represented by a + sign on the stock market charts and helps traders to take a trade decision, but what does Doji …
Candlestick chart patterns provide insights that can help you predict potential future price movements. One such pattern is the “Three White Soldiers,” which is recognized as a strong bullish signal. In this article, you will …
Swing trading is a short-term trade that is less risky than intraday and brings in an opportunity to gain comparatively higher profit. But when it comes to analyzing the stock then what are the best …