There are many reversal signals formed by candlestick patterns. One such reversal pattern is three white soldiers, a three-candlestick pattern that indicates the end of a bearish market. But how to trade three white soldiers?
Shall a trader enter immediately or is there any specific strategy to be used?
In this article, let’s get an understanding of the strategies used to trade 3 white soldiers to maximize the profit.
What is Three White Soldiers Pattern?
The three white soldiers pattern is the bullish reversal pattern, formed after the strong downtrend in the market and gives a signal of upcoming bullish trend. Here are some of the key parameters of this candlestick pattern.

Identifying the Pattern – The three white soldiers pattern is formed after the strong downtrend when the three long bullish candles are formed one after the other, each breaking the high of the previous one.
Determining the Entry Point – Once the formation is confirmed, you can place a buy order for the next candle formed.
Planning Exit Strategy – Two common exit strategies for trading the three white soldiers pattern are taking profits at the next resistance level or using the trailing stop method, which allows you to lock in profits as the price moves in your favor.
Now, this seems to be pretty simple, but taking a trading position without confirmation is like landing on a strange island without GPS. You might get trap in the wrong direction.
So, what are the ways to trade three white soldiers strategically?
Well! It is always good to confirm the entry and exit, for which you can use some indicators, and some of those are discussed in detail below.
Three White Soldiers Trading Strategy
Trading in the share market could be more profitable if a trader opens a position only on confirmation. Now, three white soldiers are a strong signal of a bullish market but it is always good to confirm the trend before making an entry.
For this, you can combine three white soldiers’ trade signals with any one of the following technical indicators.
1. Exponential Moving Average
As shown in the image above, the second candle of three white soldiers breaks the EMA 20 indicator which itself is the bullish signal and the third candle takes the support on the moving average line which gives an indication of the strong bullish trend.
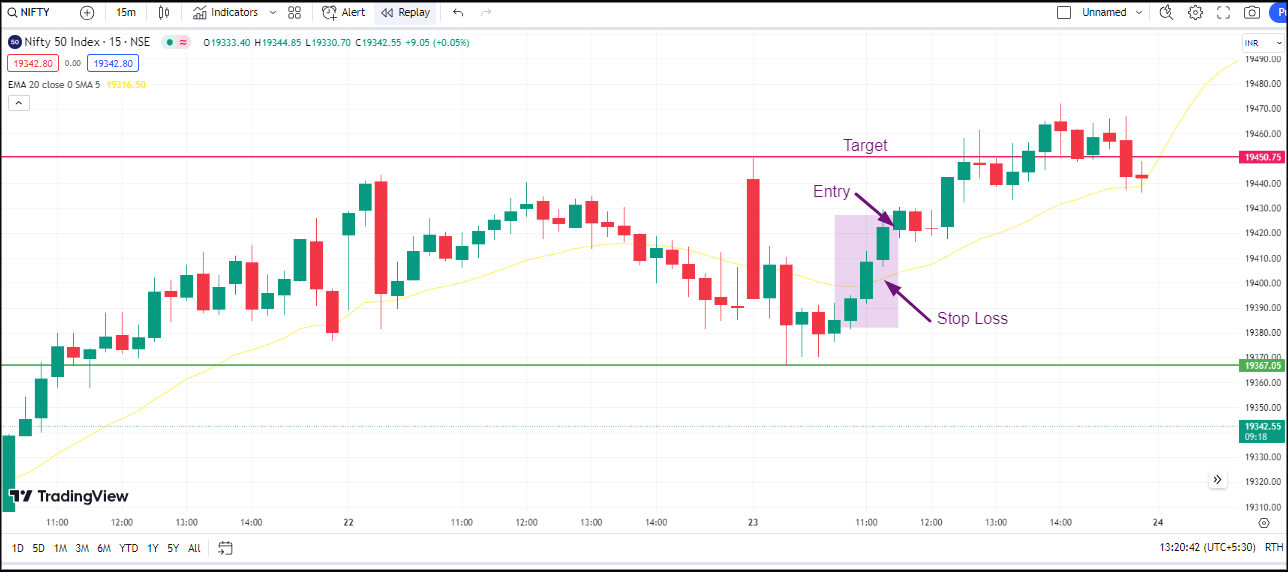 Here is the summarized trade strategy:
- Entry: Candle next to the three white soldiers
- Target: Previous resistance level
- Stop loss: Moving average
2. Relative Strength Index
Another way to take a confirmed trading position using three white soldiers is the momentum indicator Relative Strength Index, RSI.
RSI indicator buy and sell signals is generated when the indicator crosses 50 from below and above respectively. Now, as you can see in the image below, on the formation of the three white soldiers, the RSI value crosses 50 from below, giving a signal of buying in an uptrend market.
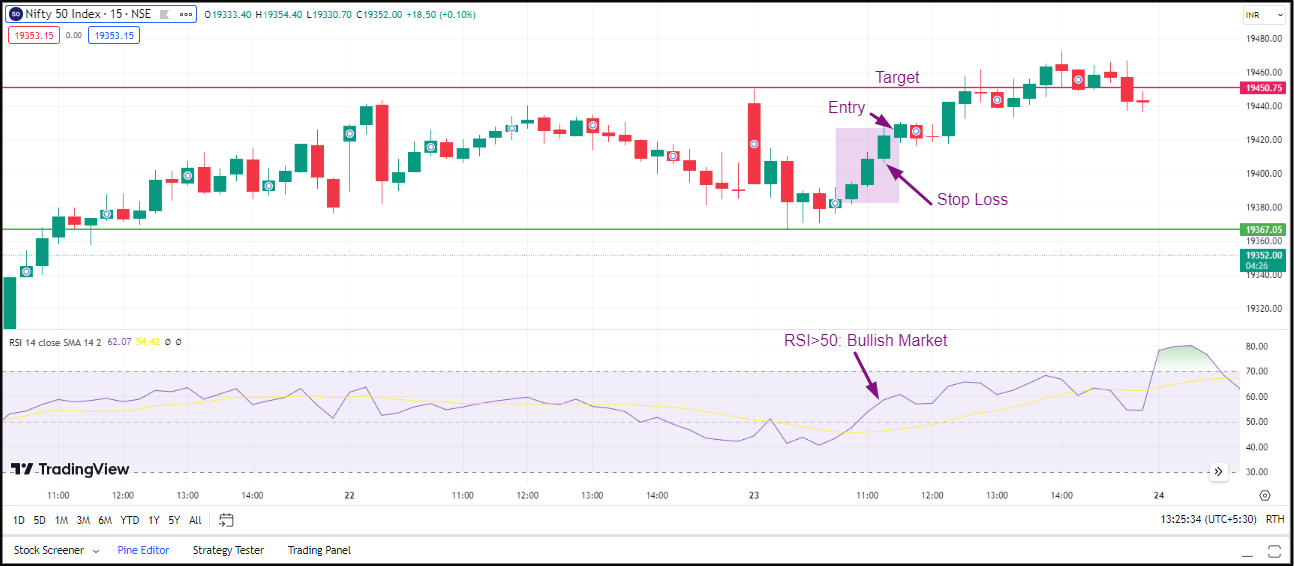 One can hold a position until RSI 70 or can place a target at the resistance value.
3. Moving Average Convergence Divergence
Another useful indicator, that not only tells about the momentum but also gives a buy and sell signal is the Moving Average Convergence Divergence. Although, traders remain confused about whether MACD leading or lagging indicator, but its use defines its role.
When looking at the indicator, it is lagging but its divergence helps in identifying the future trend and hence could be considered as leading.
Along with this, combining this indicator with the three white soldiers pattern helps you take an informed position in intraday and other short-term trades.
 Summarizing the above trade:
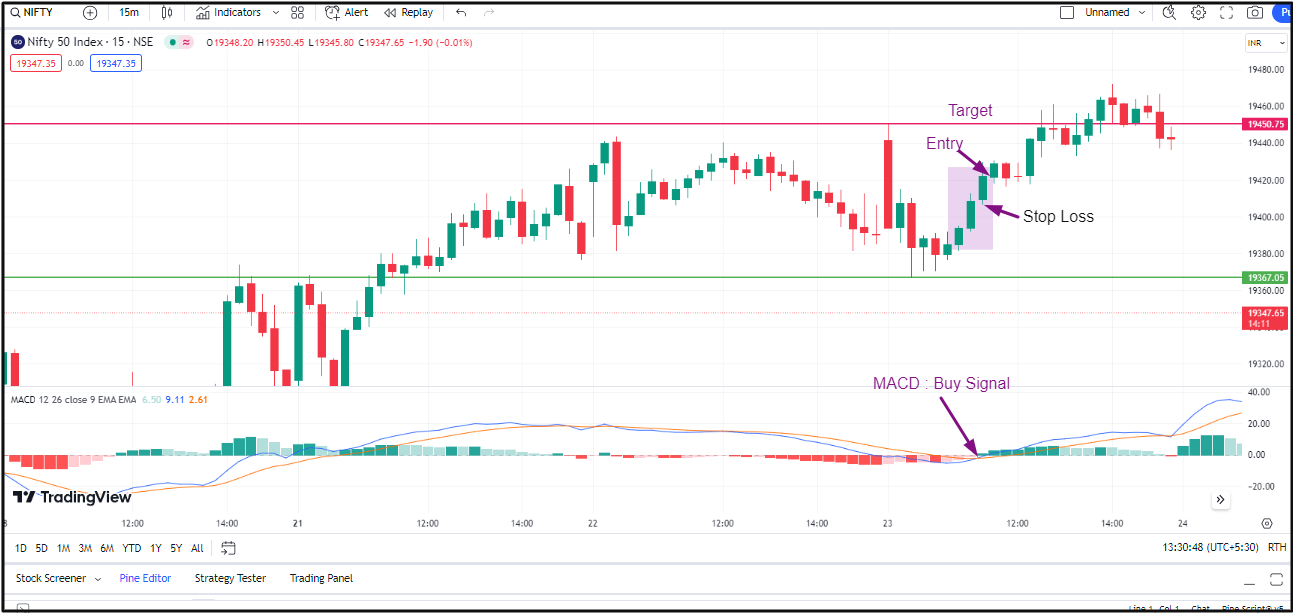
MACD gives a bullish signal at the time 3 candle formation is in process. On completion of the pattern, the MACD line trading above zero line giving a strong bullish signal. Hence, considering these parameters, traders can take a long position and book a profit near resistance level.
Conclusion
The three-sold pattern gives the trader a strong bullish signal in the market, but as the market involves risk, one should always use indicators like the RSI and moving average to confirm the signals and decide their entry and exit positions.
If you want to learn more about different chart patterns and how to trade them, you can reach out to us. We at Stock Pathshala have multiple stock market courses that can help you learn to trade online without any hustle.
In case you’d like us to call you back to explain more about stock market learning, just leave your contact info below:
Before investing capital, invest your time in learning Stock Market.
Fill in the basic details below and a callback will be arranged for more information: