Candlestick chart patterns provide insights that can help you predict potential future price movements. One such pattern is the “Three White Soldiers,” which is recognized as a strong bullish signal. In this article, you will learn what is Three White Soldiers candlestick pattern, what its significance is, and how traders can interpret and utilise it in their trading strategies.
Three White Soldiers Bullish Candlestick Pattern
The Three White Soldiers pattern is a bullish reversal pattern that typically forms at the end of a downtrend or during consolidation. It consists of three consecutive bullish candles, each with a higher close than the previous one, indicating a shift in momentum from bearish to bullish.

Characteristics of the Three White Soldiers Pattern
In a live chart, how can one identify if the three white soldiers candlestick pattern is forming or not? Here we have the major characteristics of three white soldiers.
- Three Successive Bullish Candles: The pattern consists of three successive bullish candles. Each candle should open within the real body of the previous candle and close near its high, demonstrating consistent upward momentum.
- Rising Lows: As the pattern develops, the low of each candle should be higher than the low of the previous candle, indicating increased buying pressure and a potential trend reversal.
- Increasing Trading Volume: In order to strengthen the bullish sentiment and demonstrate the Three White Soldiers pattern’s dependability, there should be a significant increase in trading volume when it forms.
The Three White Soldiers pattern suggests a strong shift in market sentiment from bearish to bullish, and it often signals the beginning of an uptrend.
When this pattern appears on a price chart, traders interpret it as a buying opportunity or a signal to close short positions. Now let’s learn how to read candlestick pattern to maximize profit.
How to Trade Three White Soldiers?
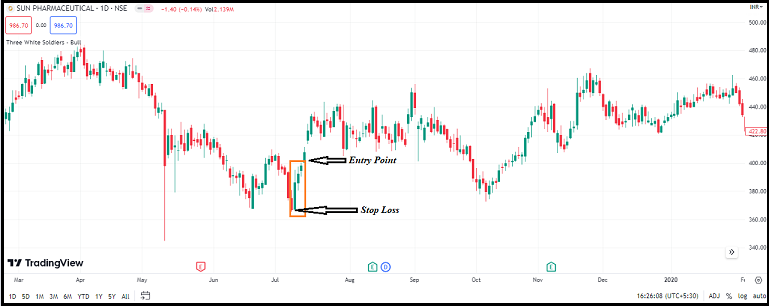
Trading using the three white soldier candlestick chart patterns includes identifying and capitalizing on the bullish reversal signal. To trade this pattern, start by looking for a downtrend or a period of consolidation.
To take a position, the first important thing is to check and confirm the three white soldiers pattern using the above points. Once confirm the short traders can place an order to exit while long position holders can enter the trade.
In order to minimize the loss, add a stop loss below the pattern’s low to manage risk. Keep monitoring the trade consistently, adjust the stop loss, and take profit levels as the price progresses.
Also, an ideal way to trade is to trade with confidence which can be done by using different technical analysis tools.
Traders often look for additional supporting factors such as positive divergence on oscillators, a break above a key resistance level, or bullish fundamental catalysts. You should confirm the signal using different types of technical indicators like the RSI (relative strength index) or stochastic oscillator. These indicators will help in validating the trend.
Three White Soldiers Pattern with RSI
RSI indicator buy and sell signals are generated by looking at their value. Since is the momentum indicator and thus oscillates between 30 and 70. The RSI 30 gives an indication of an oversold condition and possible bullish trend, RSI 70 means an overbought condition where the market can show potential pullbacks.
Now at the time, 3 white soldiers pattern is identified if the RSI takes support at 30 or crosses RSI 50 from below then this gives a confirmation of an upcoming reversal in the downtrend.
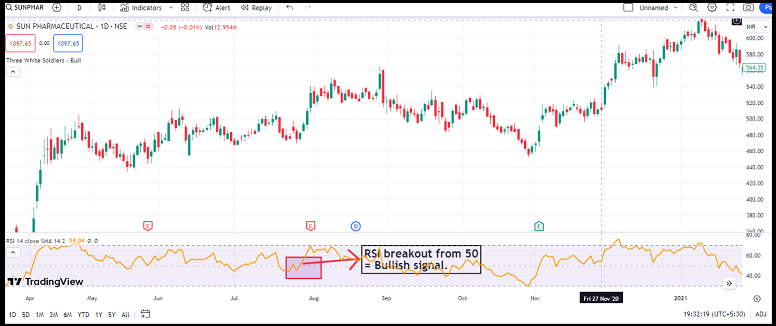
Also, one can look for RSI divergence to understand the market trend. If at the time of three white soldier pattern formation, RSI is giving a positive divergence signal (price is making a lower high and RSI the higher high) then this means a strong bullish trend in the market.
Three White Soldiers with Moving Average
Once you identify the candlestick pattern in the chart, use the 20-moving average indicator. If the price breaks the 20-EMA and closes above it then again you get a confirmation of your trade position using.
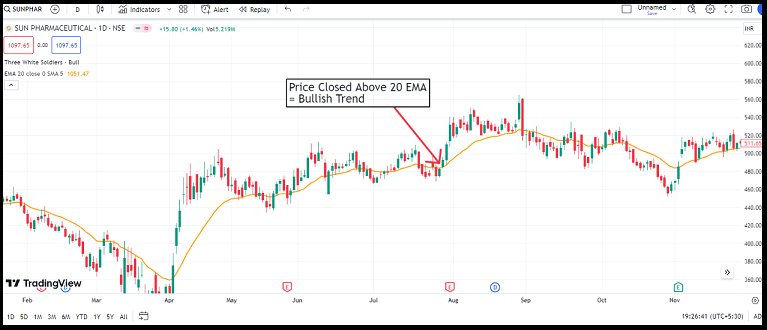
You can also use other EMA like 50, 100, or 200 depending upon the time you want to hold a position in the market. These differ from each other in terms of moving average calculation and hence can be used for different purposes and analyses.
Three White Soldiers with Volume
Along with the three bullish candles forming at the end of the downtrend, it is also important to look for the volume data. If the volume is increasing then this confirms that the short sellers are exiting and long traders are entering the market.
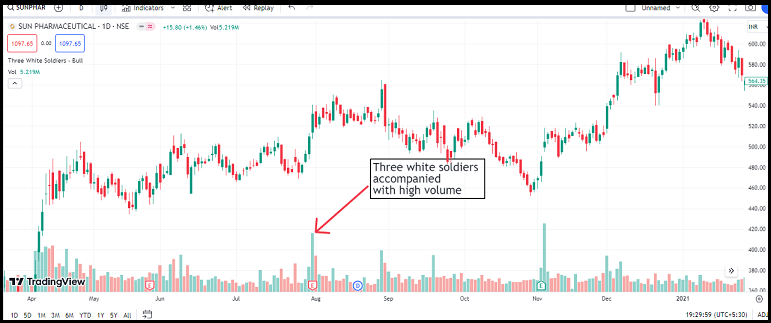
However, if the volume is low then this clearly means that the candles are formed only because the short sellers booking profit in the market and the reversal is false.
Three White Soldiers Candlestick Pattern Success Rate
Three white soldiers are one of the rarest candlestick patterns that appear almost after 3000 candles in the chart. However, the success rate is around 80% which means every time this pattern is displayed, the market has shown a good reversal and brings an opportunity to earn profit in a long position.
When combined with other technical tools like RSI and moving average the success rate increases.
Also, this pattern is a continuation pattern where each new candle is formed one after the other near the support without a gap, however, if a gap is formed then it is a false pattern and hence any analysis done on that basis could go wrong.
The pattern also comes with certain limitations where the trader gets an opportunity to enter the trade after the formation of three green candles which reduces the overall profit margin.
Get a better understanding of these patterns by referring to the right candlestick pattern book.
Conclusion
The Three White Soldiers candlestick pattern is a powerful tool when correctly identified and confirmed. It can provide traders with valuable insights into favorable entry points and the potential for capturing substantial profits.
However, as with any trading strategy, one must consider risk management, utilize additional technical analysis tools, and be aware of market conditions to make informed trading decisions and the most important learn candlestick patterns usage before executing the trade.
We at Stock Pathshala make you learn various trading chart patterns that can help you make more confident and better decisions and reduce the risk of loss to a minimum level.
Please note that trading and investing in financial markets carry risks. The information provided in this article does not constitute financial advice and should not be considered the sole basis for making trading decisions. Always do thorough research and consult with a qualified financial professional before engaging in any trading activity.
In case you’d like us to call you back to explain more about stock market learning, just leave your contact info below:
Before investing capital, invest your time in learning Stock Market.
Fill in the basic details below and a callback will be arranged for more information: