
Swing trading is a short-term trade that is less risky than intraday and brings in an opportunity to gain comparatively higher profit. But when it comes to analyzing the stock then what are the best swing trading time frames?
In this article, we will be discussing the multiple time frames and how to analyze the stock using those time frames. The swing trading time frame is basically the time frame used by swing traders to analyze and identify the trend in the stock market.
Best Swing Trading Time Frames
There are different types of chart options that a trader can use to determine the trend and entry or exit price in the market. But when it comes to swing trading, where the traders take the position in the volatile market condition, which chart can help in determining the favorable condition?
Well, for this just answer one simple question.
For how long do swing traders hold their position?
Approximately for 1 week to 4 weeks.
So, analyzing the 5-Day and 1-Month charts makes more sense to check volatility and swings. To give you the clear idea, here is the screenshot of the 5-day and 1-month chart respectively.

The 5 days chart of Coal India provides information on the weekly swings and high volatility in the stock price. Here, it is important to note that the high swings in the stock price bring in an opportunity and at the same time increase the risk of losing money.
It is therefore recommended to set a stop loss and target at the time of opening a new position for swing trading.
Now to view the monthly performance of Coal India let’s check the volatility and change in price over the month.
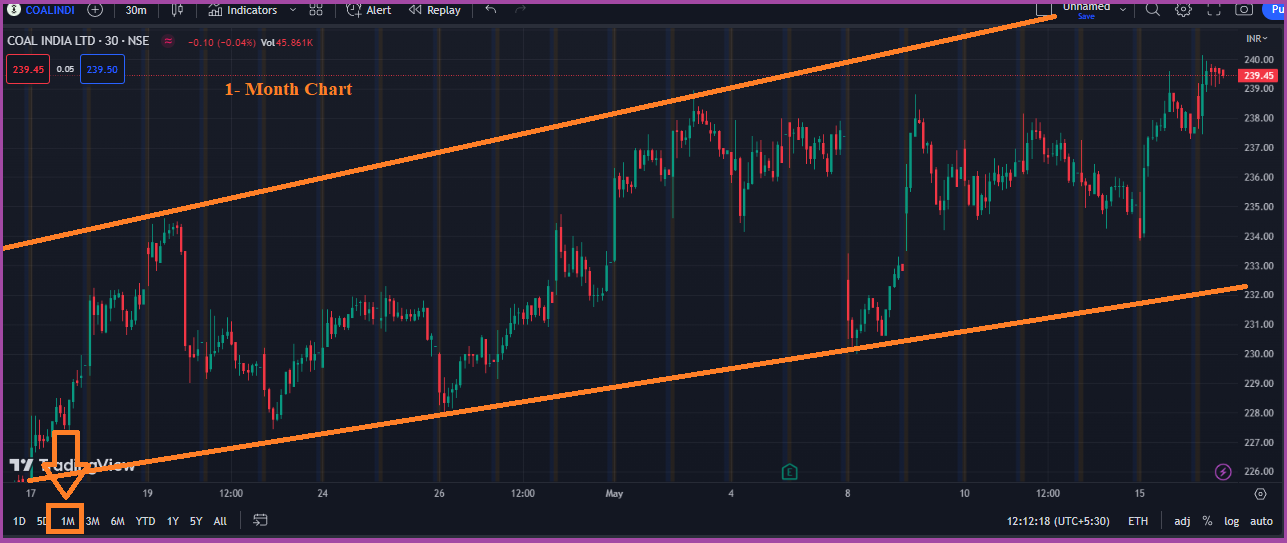
As per the above 1-month chart of Coal India, the stock is trending in the upward direction and there is approximately a 7% change in market price. But to determine the profit or return in the future, a trader must do an in-depth technical analysis of stocks using indicators and candlestick patterns.
However, before using indicators and determining the signals using candlestick patterns, one must first analyze the stock in different swing trading time frames.
These time frames are used along with other metrics such as breakout points, support, and resistance lines chart patterns used to identify and analyze the trend and get a clear idea of how the stock’s price can probably shift to decide when to enter and exit the market.
Each individual trader has his own criteria for the time frames he uses but ideally, the group of time frames to be used totally depends on the duration of the trade, i.e. for how long you want to trade.
The essential criteria of working with a time frame chart are that the longer time period chart is used to analyze the trend, and then the shorter time period chart is used to take a position in the market.
We can confirm the buying or selling points using different indicators in combination or price action strategies.
Swing Trading Weekly Chart
Unlike the 5-Day chart that provides the data of weekly movement of the stock price, weekly time frames help in determining the week-to-week movement of the stock.
Here, each candle gives us the change in the price of the stock over a week. This chart provides a wider view of the stock movement and helps in determining the overall trend.

Since the stock is trending upwards it brings in an opportunity of taking a long position in the stock. The upper and lower trend lines also give an idea of the range in which the stock price is expected to move.
Swing Trading Daily Chart
To get sensitive information, a swing trading daily chart is highly recommended. This chart breaks down the weekly candle into 5 different candles, giving more clarity on the volatility and price swings.
This further helps in determining the trend and few traders use this time frame to take a position in the trending market.
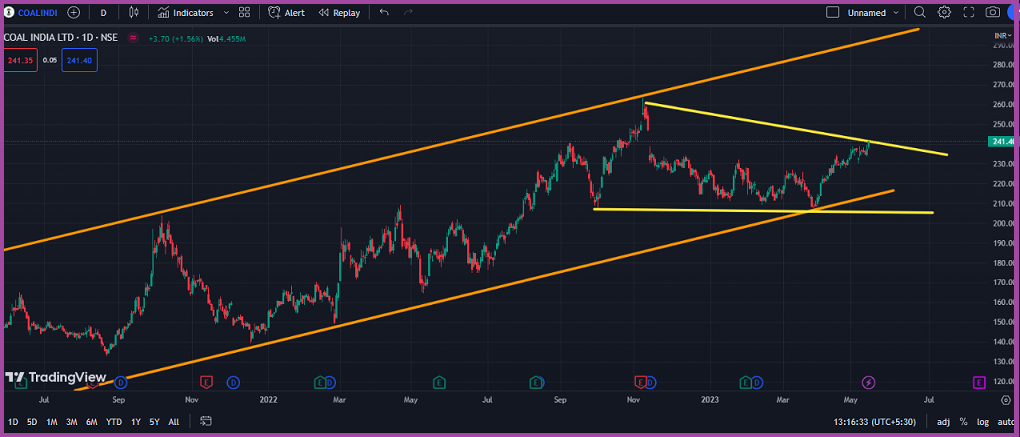
The above chart of Coal India displays two different colors trending lines. The orange lines interpret the market trend in the weekly chart. According to this the overall market is in an uptrend.
On the other hand, the yellow trend lines give more sensitive data and the range of price in which the stock is currently moving.
As shown in the chart above, currently the price of Coal India is trending near the upper trend line. Here although the stock is trending upward to take the position in the current market, the trader must wait for the breakout.
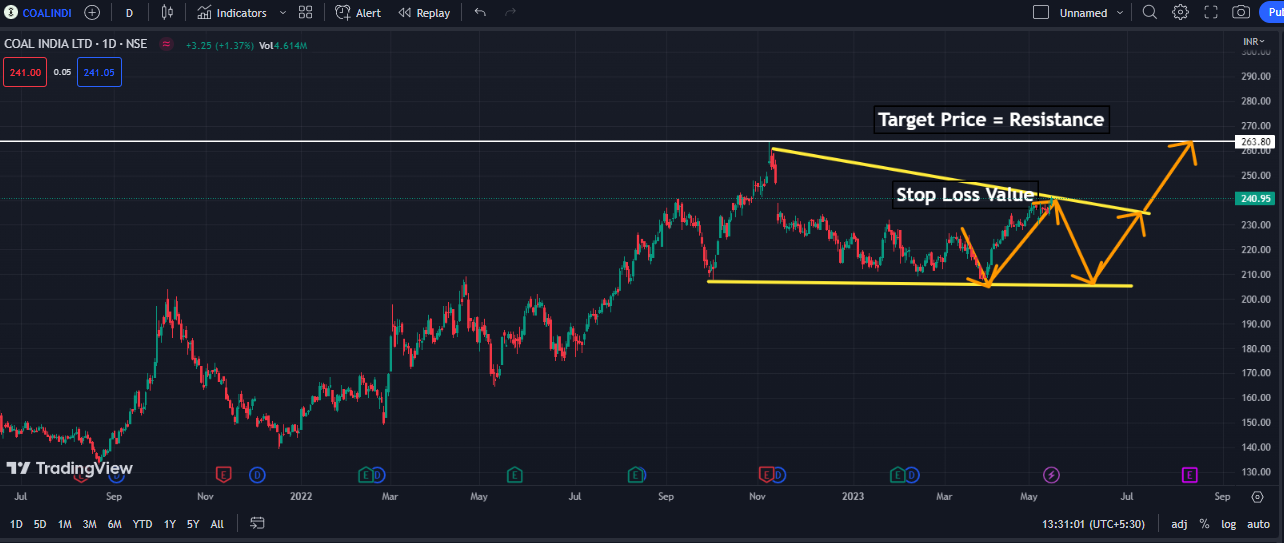
To confirm the breakout and strength of the market, use different strategies or different types of technical indicators in combination like RSI, Bollinger Bands, etc. A positive breakout helps a trader in marking their target a the resistance level as displayed below and the stop loss at the yellow line.
However, if the pullback occurs, then the traders already holding a position in the stock must exit by booking their profit in the market and should wait for the bounce back in the market.
Swing Trading Hourly Chart
An hourly time frame chart is a chart that represents the movement of stock prices within the market of a certain share within the recent hours. It is used in combination with momentum and trend indicators to take a position in the market in accordance with the trend.
Swing traders who are looking for sensitive information and different levels of support and resistance in highly volatile swing trading stocks rely on hourly charts.
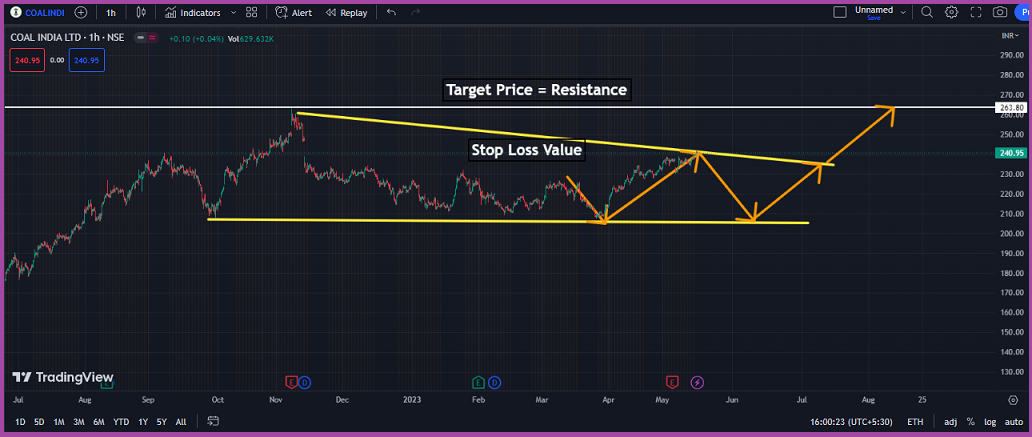
Here, the hourly chart gives further confirmation of the current trend. Also, the price is near the upper trend line, which increases the chances of both breakout and pullback. In the case of the pullback, the existing swing traders close their position however, if the breakout occurs after the pullback, it brings in the opportunity for buyers to open new positions.
Conclusion
Swing trading involves moderate risk and reward for the trader. Any beginner finding the answer to ‘is swing trading profitable‘ can plan their trades by proper analysis, defining a strategies, determining risk and then placing a trade strategically.
To gain expertise in the same, you can refer to books about swing trading.
It is good to look for the specific candle pattern or confirm the trend using technical indicators.
In case you’d like us to call you back to explain more about stock market learning, just leave your contact info below:
Before investing capital, invest your time in learning Stock Market.
Fill in the basic details below and a callback will be arranged for more information: