

MACD or Moving Averages Convergence Divergence is the technical indicator that depicts a relationship between two moving averages. Using this indicator gives you an idea of the trend but when it comes to categorizing it then comes the question: is MACD a leading or lagging indicator?
Before jumping into the detailed answer and explanation for the same let’s begin with the brief idea of both categories.
A lagging indicator is the type of indicator that shows any significant sign only when a large shift in the stock price or market has already taken place. So lagging indicators only are to make sure of any long-term trend, however, they do not anticipate anything.
Opposite to lagging indicators, Leading indicators show concerned signals before any movement in price momentum, trend or even n market happens. So in other words we can say that these types of technical indicators help in forecasting the possible changes in the price of the stock.
Let’s now find out what kind of indicator is MACD?
What Kind of Indicator is MACD?
After knowing the definition of leading or lagging indicator, it is well understood that MACD is a lagging indicator.
Wondering how?
For this let’s clear the understanding of what kind of indicator is MACD?
For this, let’s dive into the detail of the MACD indicator and how it works.
MACD indicator as already discussed is a trend following indicator that is calculated by subtracting the 26-period Exponential Moving Average (EMA) from the 12-period EMA.
Because this calculation is entirely based on moving averages, a MACD EMA strategy inherently relies on past price data to confirm the current trend direction.
The line constructed from this calculation is the MACD line. Now moving to another line, the signal line that is constructed using the 9 days EMA.
Now what to do after getting the data of the EMA of different periods.
Plotting these lines provides you with certain crossovers that further generate signals for buying or selling.
To get its idea let’s have a quick glance at the image below:
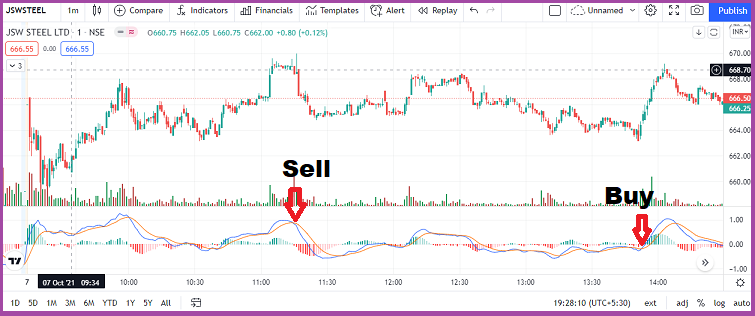
Since the MACD indicator makes use of the EMA that is plotted by considering the last closing prices of the shares and since the historical data play an important role in defining the MACD it is a lagging indicator.
Now how this lag helps you in making a buying a selling decision, for this let’s consider the example and data provided in the image above.
In the above image, it is shown that the MACD line and the signal line cross each other at some specific points. Now when the MACD line (blue line) is crossing the signal line (yellow line) from above to below it depicts the bearish signal and hence creates a chance for traders to take a selling decision.
On the other hand, when the MACD line (blue line) crosses the signal line (yellow line) from below, the bullish trend is on its way and hence you can make a buying decision.
This is all how this crossover works.
But do you think that it is always good to rely on these specifics to make a trading decision?
Of course not!
Does it mean that these technical indicators can go wrong?
Well! sometimes they can.
So how to cop with such a situation?
By combining it with other indicators. So when it comes to the best indicator with RSI, MACD acquires the top position.
Also Read: Best Indicator for Intraday Trading in Hindi
Along with this, there are other indicators too like Stochastic Oscillator, ADX etc that can be used in combination with MACD to generate better and confirmed trade signals.
You can gain a better knowledge with technical analysis courses that helps you in picking the right indicator and its combination.
Conclusion
So overall it is well understood that MACD is a lagging indicator that depicts the upcoming trend. The crossovers of the MACD indicators gives the idea of whether to go long or short in trade thus helping you in making the best profit out of it.
So, use the best use of the indicators, use them strategically and with the best combination to make your trading journey successful.
Before investing capital, invest your time in learning Stock Market.
Fill in the basic details below and a callback will be arranged for more information:


