

Traders and investors use technical indicators to guess the probable future trend. As here in this article, we’ll dig a bit deeper to know different types of technical indicators.
Since everybody in the space of the stock market wants to know the answer to only one question, “whether the market will go up or down?” Million-dollar question and clearly hard to answer.
If you’re a beginner then obviously the word Technical Indicator itself must be overwhelming to you. However, one must know that usually, it’s the short-term traders who use technical analysis sometimes individually and sometimes in combinations to plan their entry and exit accordingly.
In all technical analysis helps you in picking the stocks, deciding the right entry and exit price etc. If it seems to be confusing then learn technical analysis to give your trading a better start.
These indicators are nothing but some mathematical calculation-based entities that generate signals of future trends or say price movement based on certain historical data, trade volume, etc.
While the intraday traders use the term strategies, they generally refer to various combinations of these indicators that work best for their style of trading or as we may say that suits their trading needs.
Types of Technical Indicators in Stock Market
Technical indicators as already discussed help you to analyze the market condition, but since there are different types of indicators, each one plays a specific role in analyzing the market condition.
So are you using the right kind of indicator for the market analysis?
Well for this it goes into the details of 4 different categories and further the types of indicators under each to come out with the right analysis result.
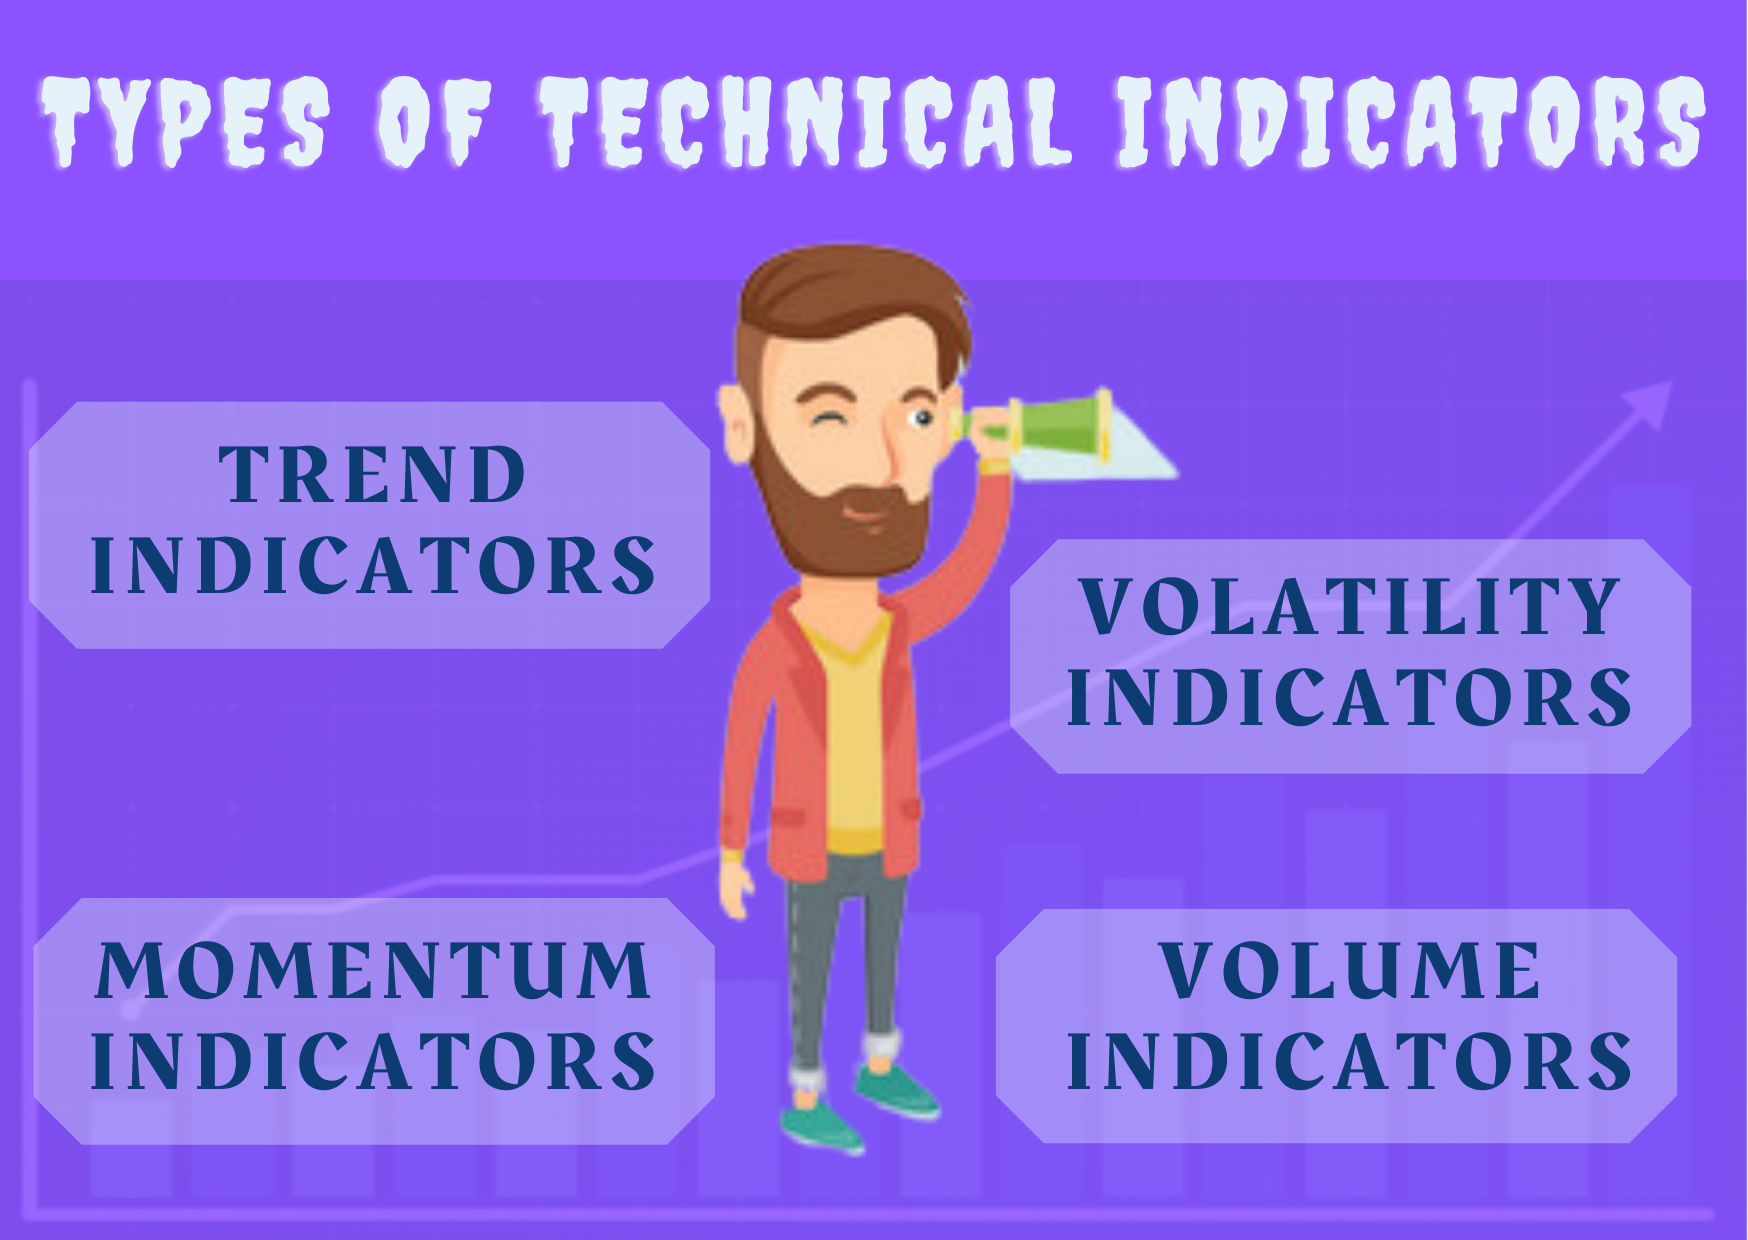
So here are the four different categories of technical indicators:
- Trend Indicators
- Momentum Indicators
- Volatility Indicators
- Volume Indicators
 Trend Indicators
 Trend Indicators
 The market either goes bullish or bearish? But how strong is the trend or how long the particular trend continues?
This is important to know to make the right entry and exit decision from the specific stock.
In order to define and determine the strength of the particular trend, these indicators are used. In general, in this, the averaging baseline is formed using one or more average-based indicators.
The baseline is formed either by considering the opening or closing price of the share.
Once the baseline is formed, one can analyze by seeing the price trend.
How?
By viewing the price movement with the baseline. If the price moves above the baseline, it depicts the strong bullish trend, on the other hand, the price moving or trending below the baseline gives the sign of a bearish trend.
Thus these trend indicators majorly are to observe the trend performance over a period of time. This means trend indicators are majorly used by the mid to long-term traders, for observing a trend of the larger time frames.
Some of the Trend Indicators are discussed in detail below:
Moving Averages
Moving averages creates the baseline by considering the closing price of the shares over a specific time period. Here the time duration depends upon the type of trading you are into.
For example, intraday traders generally prefer a short time frame of 9 periods, mid-term traders go for 26 to 50 days while long term prefers the time of 100-200 periods for the analysis.
Now using the Moving Averages for stock analysis helps the trader in analyzing the current trend and gives an idea of when the trend can reverse.
You might be wondering is Moving Average a good indicator, then before concluding the same let’s have a look at some of its major features:
- Moving averages are widely used technical indicators that work on a simple formula of averages of the closing prices of past trading sessions.
- It is a line that defines the trend of the stock which is further used to analyze the probable price fluctuations in the ongoing trend.
- Moving average calculation can be simply done by considering the closing price of the stock. Also, you can use the open, high or low price to calculate moving averages.
- If the SMA line shows an upward movement with the closing price rising above this line, a bullish trend is to be followed and so giving a good buy signal. On the other hand, when the closing price is sliding below this line a bearish trend is to be seen. Thus giving a sell signal.
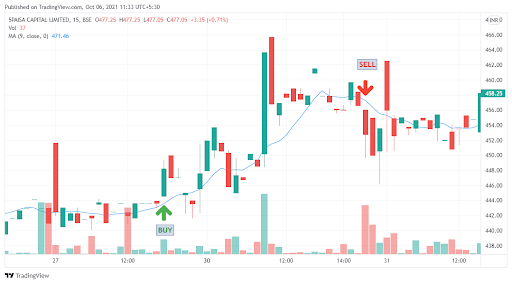
From the above image, one can take a particular position only by viewing the trend line.
The price candle at around ₹444 is above the moving average thus giving the buying signal. On the other hand, the candle at ₹454 closing below the moving average gives a strong selling signal to the traders.
This is how you can make use of the trend signals generated by Moving Averages. You can use this indicator along with three white soldiers candlestick pattern to get a better and confirmed trade signals.
Parabolic SAR
Parabolic SAR (Stop and Reverse) is yet another trend technical indicator that generates signals at most probable reversals in the ongoing trend.
- Parabolic SAR appears as a dotted line placed either above or below the price based on the price movement.
- When the dots are wide apart, a strong trend is observed, either bullish or bearish, and when the dots are tightly packed, it indicates a short-term trend or a weak trend.
- However in the consolidated phase, this indicator might mislead the trader by giving false signals, so Parabolic SAR is used with the MA indicator, to get a sure shot signal either for going long or short.
This can be understood in the image below;
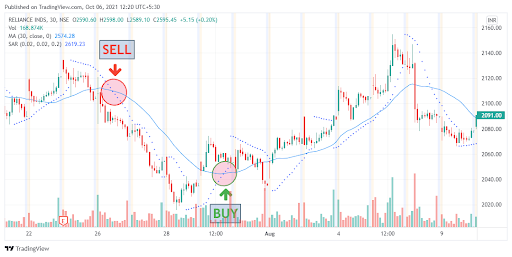
- At “SELL” in the shaded area a crossover is seen, in which both the MA line and the SAR is above the price indicating a perfect short-selling signal
- And at the “BUY” once again we can see that the SAR and MA line is below the price indicating a future bullish trend in the stock and hence giving a good signal to enter a long position.
In order to know the strength of existing trends, one can rely on an indicator like the Average Directional Index, which measures the strength. Know how ADX indicator works and add it to your current trading strategy.
Traders who know how to use ADX for Intraday trading can read the trend easily. As a result, they accumulate a hefty profit in their pockets.
Momentum Indicators
These types of technical indicators help in identifying the speed of price movement over a certain period of time.
In this case, the closing prices play a major role as the calculation for this indicator is done by considering the difference between the current closing price and the previous closing price of the stock.
The value calculated with the difference is ultimately in understanding the strength and weakness of the stock price.
Confused?
The momentum indicators help in determining the speed with which a particular stock price can increase or decrease.
Let’s talk about some of the momentum indicators to get a better idea of how these indicators work:
RSI
RSI or Relative Strength Index is one such technical indicator that works on the concept of price momentum. The value of which tells the overbought or oversold condition of the stock based on the stock’s velocity of change.
Higher the value more is the buyers and thus the future trend might go downwards. Similarly, the low value of RSI depicts that there are more sellers than buyers and hence the price might take an uptrend in the future.
- RSI indicator buy and sell signals are generated below 30 or above 70 respectively.
- When the value hovers near 70 or even crosses the mark, one can anticipate an overbought situation and thus stay on the lookout for a good sell position.
- On the other hand, in case this value reaches near 30 and is trying to go even lower, an oversold situation is seen and thus a buying signal is generated.
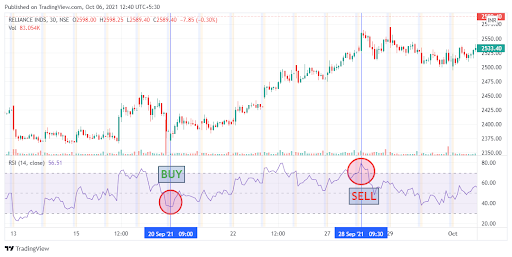 In the image above, when RSI reaches around 36, a good buy signal is generated and thus we see a further uptrend. However, when the RSI is seen at 79, we see an overbought condition indicating a probable lower trend and thus get a good sell signal.
Also, you can make these signals more strong by combining them with others in the list. In all the right technical analysis knowledge gives you the information of best indicator with RSI.
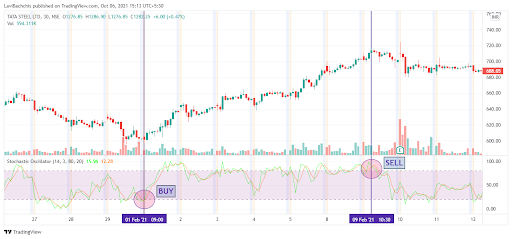
Stochastic Oscillator
Talking about another such technical indicator, the Stochastic Oscillator is a momentum indicator that helps in predicting the sudden price reversals or fluctuations by comparing the closing prices to the normal price range.
- Just like RSI, the stochastic oscillator indicator gives the idea of overbought and oversold conditions in the stock and ranges between 0 and 100.
- However, this consists of two lines, the %K line (green line) and the %D line (red line).
- Interpretation of Stochastic oscillator is done based on individual trader’s style and needs, some look for overbought and oversold conditions whale some take actions based on the crossovers between the two lines of the oscillator indicator;
- When %K line crosses below %D line: SELL
- When %K line crosses above %D line: BUY
Volatility Indicators
As the term “Volatility” suggests the degree of variation in the price movement of the stock; volatility indicators are the technical tools used to measure this price fluctuation of the stock in the share market.
Point to be noted, My Lord! This measurement of the variation is regardless of the direction of the price movement. And is usually calculated based on the highest and the lowest historical price data.
Due to which a defined range is determined in which the price usually fluctuates until the breakthrough happens. This is the range in which investors or traders can either go long or short in order to gain profits.
This, in turn, helps in identifying the points where the market or the price can show the reverse in the underlying trend. However, there is no certainty in this, or even in the stock market as a whole.
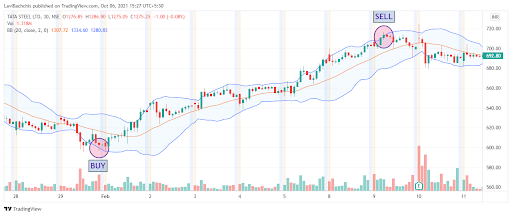
Bollinger Bands
Want to determine how volatile the share could be?
Rely on the Bollinger Bands, the best volatility indicator that helps in identifying the “Maybe” highest and the lowest price based on the previous trades.
Here are some of the top features of the indicator:
- It comprises 3 components, this indicator indeed is one of the most famously used indicators by traders.
- The moving average line at the center, the upper limit line, and the lower limit line are the ones that define a certain range in which the stock price fluctuates.
- So it is said that when the price falls below the lower limit line which is basically the standard deviation of -2 degree value, a bullish trend is to be expected in the near future, meaning a buy signal.
- And when the price crosses the upper limit line of SD value +2, a bearish trend is to be followed, giving a decent sell signal.
Volume Indicators
As the name suggests, volume indicators are the technical tools that help in measuring the strength of a trend of any particular stock. However, by now it is clear that each indicator has a different story to tell.
The volume indicators that is why to use the data to project its own results based on different other indicators they are used with. Again it is said that when the volume increases it signals towards a strong trend.
And it’s an obvious fact that it’s the volume that leads to small or large price movements in the stock.
These volume indicators in technical analysis are the most common that the traders use to understand the strength of a trend along with the small price fluctuations.
On Balance Volume
OBV or On Balance Volume is one of the examples of Volume Indicators in which the investors or the traders can understand the distribution by comparing the trade volume to the price movements.
Volume Rate of Change
Another example is the Volume rate of change, which indicates the highlights meaning, the high points, and the low points along with the breakout points in the underlying trend based on the volume.
Conclusion
Finally that you are aware of these 4 main types of technical indicators, we hope you get clarity of which type of indicator will suit your trading style and help you in meeting your financial goals. There are more such indicators like ADX, VWAP, Ichimoku cloud, etc that can ace the trading experience.
Not just that, since it’s all about prediction, do not miss out on the fun of experimenting and trying different combinations of these indicators as per your trading needs and thus create your own strategy.
Also, to make the study better start with the technical analysis course. It gives you basic and detailed information of how to pick the right stock for intraday or long-term trading.
Before investing capital, invest your time in learning Stock Market.
Fill in the basic details below and a callback will be arranged for more information:


