

VWAP can be your best friend when you want to decide the entry and exit point, especially in intraday trading. Although generally the reliability of technical indicators is often argued about, it still presents a strong argument against trading with just emotions.
But what is VWAP, and how can it help you in making your trading decisions? Let us talk about all this at length in this article.
VWAP Indicator
Before diving into the intricacies of this indicator, do you know the VWAP full form? It stands for Volume-Weighted Average Price.
As the name suggests, the indicator calculates the average price at which a particular security is traded throughout the day, and it is weighted according to the volume.
This is a unique indicator that tells the trend of security. It also gives you fair information about the buyers and sellers at a specific price.
This indicator is readily suitable for intraday trading as it lays out both the price and volume information. It also helps them in figuring out and understanding the trends properly.
It appears like a straight line, similar to that of the moving average. The difference between them is that the moving average does not show the volume.
The best part of the indicator is that it compares the current stock price to an already set benchmark. It makes it very convenient for the trader to decide the entry and exit prices.
Another thing to keep in mind is that it is calculated every day. This means that it ends when the market closes and begins afresh from the opening of the next trading session.
But the next question is, how is it calculated? Let us have a look at the same.
VWAP Calculation
We now know that the VWAP value is calculated every day; therefore, in the calculation, only the intraday data is utilised.
The VWAP is calculated by the formula,
Typical Price * Volume/ Cumulative Volume
- Take a period (1 minute, 5 minutes) and calculate the average price of the same.
- Typical Price – High+Low+Close/ 3
- If you want to keep the VWAP value for the entire day, you just have to add the typical price from each period to the preceding values.
Let us understand this with the help of an example.
There is a security with a high price of 50, a low at 35, and a closing price of 45. The typical price in this case will be,
(50+35+45)/3 = 43.33
Now let’s suppose that the volume in that trading session was 20, and the cumulative volume was 70, then the VWAP will be
VWAP = 43.33 * 20/70 = 12.38
This is the VWAP value that is plotted as a line on the stock charts and they can easily help you determine the entry and exit point.
VWAP is an important indicator as it tells the trader about the trend and the right entry and exit point. There can be the following cases.
- VWAP < Market price – Bullish
- VWAP > Market price – Bearish
Let us understand this with the help of an example. If the VWAP is ₹15 and the buy price is ₹10, then there are higher chances of profit. But if the VWAP is ₹15, and the buy price is ₹20, then a trader is more likely to face losses.
It is important to not just have a proper understanding of the indicator but also how to use it. Therefore, let’s have a look at how you can use VWAP and make good intraday trading profits as well.
How to Use VWAP Indicator?
VWAP can be a great tool for all intraday traders as it gives them the opportunity to identify the right entry and exit points.
However, to get the most accurate signals, you must decide which time frame is best for VWAP based on your trading style.
Scalpers often use 1-minute charts, while trend traders prefer the 5-minute view
On the stock charts, then it is plotted like a straight line. So before knowing how intraday trading works, it is important that you understand the working of VWAP.
Let us understand how you can define the trend when looking at the VWAP indicator.
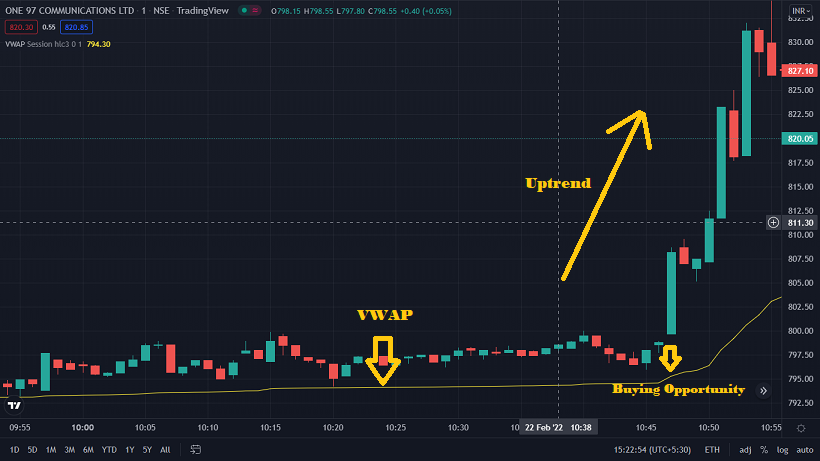
- When the VWAP is below the market price, it is the right opportunity for the traders to take a long position as the market sentiments are very bullish at the moment.
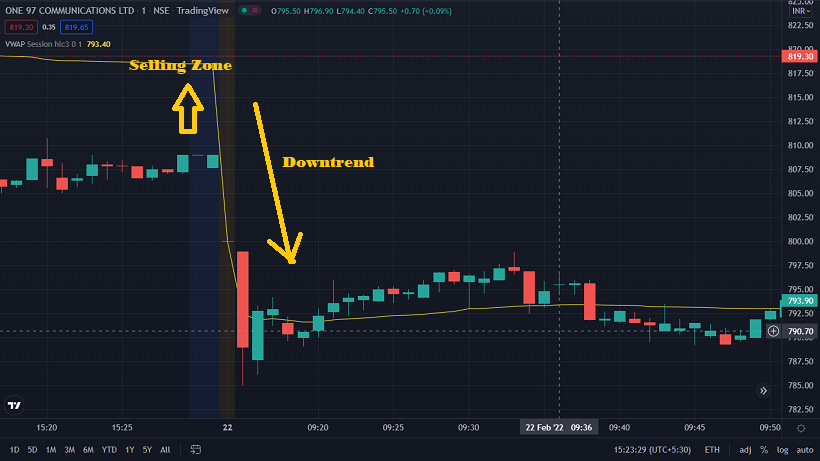
- When the VWAP is above the market price, it is the right time for the traders to sell their stocks as the market at this time has bearish sentiments.
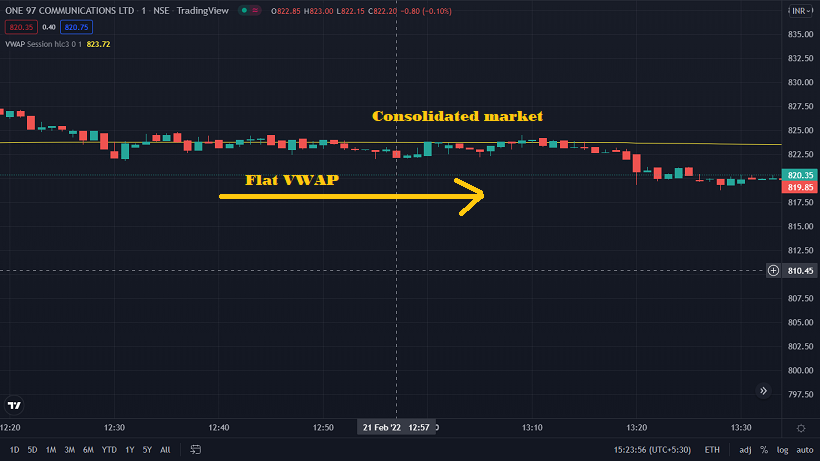
- The VWAP is often flat when the market is in the consolidation phase.
Apart from this, it also has an upper band and a lower band. These bands are nothing but the standard deviation of a stock price. The upper band often acts as the resistance level and the lower band as support.
If the prices move below the VWAP and then in some time crosses the VWAP line and after a few bars close above it, there are higher chances that it will move towards the upper band and attain a new resistance. This is also a good time for the traders to take a buying position. We can say that the crossing of the VWAP line can sometimes work as a breakout zone.
In cases when the prices are moving above the VWAP and cross the middle line or the VWAP line, then there are chances that it will have a bearish run and the prices might reach the lower band.
Now, VWAP definitely serves as a holy grail for every trader, it is
But just like any other indicator, VWAP also works best when combined with other indicators like RSI, moving averages, etc.
Now that you know how to use VWAP for trading, it is also essential to look at the importance of the indicator for a successful trader.
Importance of VWAP
It is important to use the right indicators when you are trading in the stock market so that you can enter and exit at the right time and therefore gain better profits.
VWAP rightly tells you not just about the price movement but also the volume. It is very important for a trader to get the hang of the volume as well. Not having appropriate information about the volume can often lead to false indications.
For example- An increase in the price but no increase in volume can often lead to false bullish signals.
Let us now discuss its importance specifically for intraday traders.
- It is an important indicator to have a timely idea about the bullish or the bearish market. It can further define the entry and exit points for a trader and help them in making profits.
- Unlike moving average, VWAP talks about the volume as well. This is the reason for lesser false signals.
- It sets the benchmark for the traders about the average price of the security at a particular session and a particular day.
- VWAP not only tells you about the market sentiments but the bands along with it serve as the indicator for support and resistance (learn more about support and resistance in Hindi for your own comfort).
VWAP therefore can guild a trader to better profits and if used with the right set of indicators, it can yield great results. But not only the advantages, but there are also some limitations of P as well. Let us have a look at the same.
Limitations of VWAP
It is always said that you should not rely on a single indicator for your trading decisions. Similarly, you should also check the limitations and the information provided by the indicator that you are using. VWAP although is a great indicator, but it also has some limitations that a trader should keep in mind while taking the major decisions based on it.
- You cannot use this indicator for longer periods. It is restarted at the onset of every trading session because it is a day indicator. If you check the VWAP for more than a day, there are possibilities that the average that you will get will send a false signal.
- As discussed earlier, the perfect buying opportunity is when the VWAP is below the market price. But in some situations, like a strong uptrend, the VWAP keeps moving above. In such cases, waiting for the market price to drop below the VWAP can often make an investor miss the golden opportunities.
- It is a lagging indicator and can often miss out on important trading signals.
It is always better to use the combination of two or more indicators to ensure better results.
Conclusion
The stock market is a great place to be if you enter with the right mindset and a will to learn. There are a lot of indicators that can guide you to the right trading decisions. And the technical indicators serve as the best friend of intraday traders as well.
VWAP works moreover as a benchmark rather than an indicator and guides every intraday trader to make great profits. It is a perfect combination of price trends and volume for every trader who is looking for the right entry and exit point.
You can also take the technical analysis course for a better understanding of technical analysis or opt for books for technical analysis. Apart from this, there are various stock market courses that can boost your trading experience.
If you want to gain a better understanding of the stock market-related terms, you can download the ‘StockPathshala app and start learning.
Before investing capital, invest your time in learning Stock Market.
Fill in the basic details below and a callback will be arranged for more information:


