

When doing trading in the stock market, the simplest indicator on which traders rely upon is the moving average. But the moving average is further of two types, SMA and EMA. In this article, we will be understanding the major points of SMA vs EMA to conclude which is better and why.
Here we will be considering the major differences of how the two indicators differ in terms of time frame when doing intraday or swing trading.
Let’s begin by understanding the meaning of SMA vs EMA.
Simple Moving Average and Exponential Moving Average
Both simple and exponential moving averages are the technical indicators that give information of the trend.
Both the indicators are interpreted in a similar manner, the only difference is that the simple moving average calculates the average of the stock prices of the defined period while EMA relies more on the latest data thus providing better and more sensitive information.
In simple terms, the major difference lies in the moving average calculation for both these indicators.
Let’s see how these two indicators differ from each other in analyzing the price trend.
As shown in the image above, we have taken the 20-period EMA and SMA in a day chart shown by white and yellow lines respectively.
Here the EMA line gives better and more sensitive information by interpreting the price change on the basis of the latest data.
Let’s now have a look at how to set and use both these indicators on different time frames of trade?
SMA vs EMA For Day Trading
Intraday trading involves quick decisions making and this makes it important for traders to rely on sensitive information especially when it comes to price change.
Here as compared to SMA, EMA helps in doing better analysis of the price trend and hence helps in making a quick decision.
Further, it becomes important to check for the time period in which both these indicators help in generating comparatively better results.
So, here for SMA, one can rely on the 5, 8, or 13 periods moving average or the combination of three while the ideal EMA setting for intraday trading is 8 or 20 periods.
This gives traders an idea of getting an idea of bullish or bearish trends.
Let’s find out the detail of these periods in the chart below:
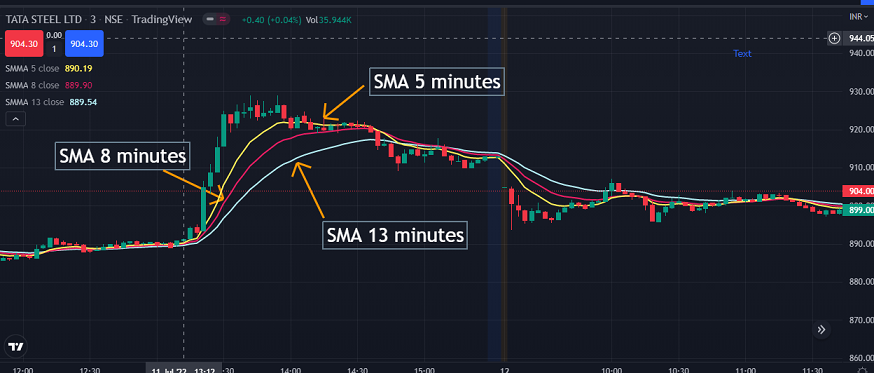
In the chart above, the smaller the SMA period, the higher is the sensitivity. Similar is the case of EMA, however, the setting differs from the one done for SMA.
SMA vs EMA for Swing Trading
As you know swing trading can last from weeks to 2 or 3 months. Traders can use both SMA and EMA to find out trends. Here again, the difference lies in the setting for both the indicators.
One can set SMA at 20 days, 50 days, 200 days or a combination of all to gain information on current trends.
Other than this, there is an EMA indicator which is generally set at 5 days, 15 days, or 30 days to pick and analyze stocks for swing trading.
SMA vs EMA Crossover
Apart from the trend, these indicators help you in identifying the buying and selling points. For this, one has to pick the right periods and identify the crossover.
Let’s make it simpler for you to understand. As discussed above there are different periods in SMA and EMA that give you information on the trend. Here higher the value of time slower is the speed or let’s say lesser will be the sensitivity of data.
So, if you pick the 5 and 21-period SMA or EMA, the 5-period is the fast-moving average while the 20-period is the slow-moving average.
When the fast moving average crosses the slow-moving average from above, it gives the signal of the bearish trend and hence brings in the opportunity for traders to short their position or square off their current position.
Similarly, there is a bullish crossover where the fast-moving average crosses the slow moving average from below.
Here is the image of the crossover of the 9-period SMA and 21-period SMA.

Now when considering the difference between SMA and EMA crossover, here is the detail of how to do its setting on the chart for different types of trade.
Moving Average Crossover Trading Type Type of MA SMA EMA Intraday Trading Slow Moving Average 13 Periods 20 Periods Fast Moving Average 5 Periods 5 Periods Swing Trading Slow Moving Average 50 Periods 50 Periods Fast Moving Average 20 Periods 12 Periods
SMA vs EMA Which One is Better?
Both SMA and EMA have their own advantages and disadvantages. They can be used in various trade segments like intraday and Swing. But before using them on the chart you should know now which one is better.
Simple moving averages and exponential moving averages are technical indicators that are used by traders for market analysis and to get a better understanding of underlying trends i.e. whether there will be an uptrend, downtrend, or trend continuation will follow.
The working of SMA and EMA is the same. They help to smoothen the security prices over a predefined time period.
They use previous price data so they fall under the category of lagging indicators but both SMA and EMA differ in how they give weightage to price data. Let’s tell you.
SMA gives equal weightage to price data irrespective of the period while EMA gives more importance to recent price data which is why it is also called weighted moving average.
Also, their calculation method also differs which we have discussed separately in other blogs.
If applied successfully both SMA and EMA can be immensely beneficial for a trader. Here is everything summed up about them.
SMA Vs EMA Moving Average Summary Use Caution SMA It is a slow-moving average, commonly used to confirm the prevailing trends rather than predict new trends. Best for long-term trades. It is also used to calculate EMA. SMA reacts slower to markets which is why you can miss some good buy and sell signals in case you use SMA alone. EMA Faster Moving Average which gives more weightage to recent price data. Good for short-term trades in which the most recent price data is required. EMA reacts faster to the market so you can take a sudden price spike as a trend so be cautious if you observe a sudden increase in prices.
Conclusion
Considering the above data and information it can be concluded that both SMA and EMA indicators are helpful in generating signals for different types of trade. Here the one who wants to place the swing and positional traders can rely on the SMA for analyzing the trend.
On the other hand, EMA is a comparatively better indicator for intraday and short-term trades like scalping.
Choose the right time frame and build your strategy to pick the right position at the right time.
In case you’d like us to call you back to explain more about stock market learning, just leave your contact info below:
Before investing capital, invest your time in learning Stock Market.
Fill in the basic details below and a callback will be arranged for more information:


