Trend is a friend in trading, but these trends become weak with time and therefore there is an indicator, ADX to identify the same. So, here is the question, how to use ADX for intraday trading?
In this article, let’s discuss in detail the uses and application of the Average Directional Index in trading.
What Does ADX Indicator Measure?
Trending markets pave the way for a trader’s profitable journey. Most traders make these 2 rookie mistakes and lose money in trending markets:
- Entering late into a trend
- In the hope of a rebound, they do not cut losses despite the market taking a reversal
So how do we determine the strength of a trend? What if the market takes a reversal, what if the market goes sideways?
To remove the hurdles of determining the power of trend we have an indicator named ADX or Average Directional Index.
It helps our day traders to know the sturdiness of the trend and tells them how long it will continue.

It is depicted as a line from 0-100, if the line is above 25 the trend is strong, and below 25 shows a weakening strength of a trend.
You can easily find this indicator in the indicator option on your charting platform. Its default setting is 14 periods. You can keep the period anywhere between 7 and 30.
Although based on the nature of day traders, the ADX setting for day trading varies from 3 to 30, we will discuss this further in the article.
The important thing to note here is that it only tells the strength not the direction of the trend. For that, you can opt for a DMI indicator or a Directional movement indicator.
It is usually used in conjunction with ADX. DMI has 2 lines, one positive shown as +DMI and one negative shown as -DMI.
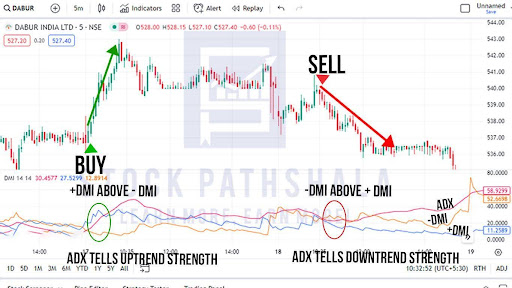
- If +DMI is above -DMI, then it is an uptrend and ADX values measure the strength of the uptrend.
- If -DMI is above +DMI, then it is a downtrend and ADX values measure the strength of the downtrend.
How does ADX help an intraday trader? How to use the ADX indicator for day trading? Now that we know all the basics about how ADX indicator works, here are some of its implications :
1. Identifying Concrete Trends
As we already know ADX above 25 signals a strong trend but what is the intensity of the trend? Let me help you with it.
| ADX Indicator for Strength Determination | |
| 0-25 | Weak Trend |
| 25-50 | Strong Trend |
| 50-75 | Very Strong Trend |
| 75-100 | Extremely Strong Trend |
Usually, a trader should wait for ADX to cross the level of 50 as a signal of a very strong and prolonged trend to come. Then only should he/she enter into a long or short position as per the market opportunities.
2. Risk Management
Before entering into a trade we set take profit and stop loss levels. As the ADXC tells the strength of the trend, an ADX below 25 could indicate a weakening of the prevailing trend in which you might have taken a position.
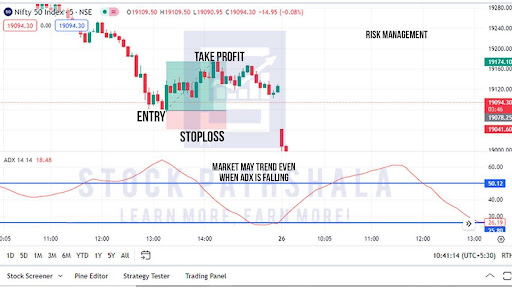
So if this happens you can close your position before losing any more profit.
3. Identifying Market Reversals
After a long run, a trend eventually comes to a halt and the market goes into consolidation. Here ADX can tell us if there is any possible reversal coming or not.
For example: ADX showed a reading of 75 and the market was in an uptrend. You took a long position. After some time ADX came back to 20 which means that the uptrend’s momentum is exhausted and now sellers might take over the market.
ADX Setting For Intraday
ADX’s default setting of 14 periods seems to be a very long time. Here the period refers to the time for which data is collected and depicted as a line. If we have a 5-minute chart, then ADX for 14 periods shows the data of 70 minutes [ 14*5 = 70 ].
The smaller the period the more swiftly ADX will reflect price fluctuations.
The best setting for intraday is 3 periods as it increases the sensitivity of price movement. So in a 5-minute chart, ADX of 3 periods will show data of the past 15 minutes.
Just put 3 in ADX smoothing and DI length. These ADX indicator settings can be used by Scalpers and other day traders.

- Buy signal or entry in Long position: When the price of a stock is rising and ADX is also rising.
- Sell signal or entry in Short position: When the price of a stock is falling and ADX is rising.
| ADX Signals | ||
| ADX | Price | Action |
| Above 25 | Increasing | Buy |
| Above 25 | Decreasing | Sell |
An ADX below 25 will show a weak trend followed by a strong trend in a market where the ADX will be above the 40-50 level.
Best ADX Setting For 5 Minute Chart
For day traders there are certain time frames that play an important role in determining and assessing the moves of the market and capitalizing on such moves.
A few such timeframes include 1-minute, 5-minute, and 15-minute chart frames. So what will be the best ADX setting for day trading in a 5-minute chart frame?
Put 7 in the ADX smoothing and DI length on a 5-minute chart frame. This will give you more reactive trend strength for a shorter period.
ADX And EMA Strategy
Now that we know how to measure the force of trend, let’s add another technical indicator for better and more reliable signals. We will use ADX with EMA or exponential moving average on a 5-minute chart frame.
The default setting for EMA is 9 periods. Let’s keep the setting of ADX and EMA both for 14 periods.
- BUY SIGNAL: When ADX crosses the 25 lines and a bullish candle closes over 14 EMA, you can enter into a long position.
- SELL SIGNAL: When ADX crosses 25 lines and a bearish candle closes below 14 EMA, you can enter into a short position.
Conclusion
Now that we know the strength of the trend, it will provide ample opportunities for our day traders to enter into positions that will make them profits.
We have discussed the settings for various time frames and the buying and selling opportunities associated with them. As we say, “ trend is a friend ” in the stock market.
With ADX we now know what is or what will be the mood of trend. We hope you gained clear insights into the use of use of ADX strategy for intraday trading. Those who know how intraday trading works can use this indicator to study the market comprehensively.
Risk management is also possible for our position as we can speculate the momentum of trends reflecting short-term price fluctuations of the market.
Lastly, as it is an “indicator’’, it will only tell you the probability of trend projection going in a certain way, for better confirmation you can always use ADX with other types of technical indicators available like MACD, RSI, or for that matter use ADX with two EMA’s.
If you want us to explain concepts about the stock market, just fill in the below form with your basic details.
Before investing capital, invest your time in learning Stock Market.
Fill in the basic details below and a callback will be arranged for more information: