
Support and resistance are the levels that depict the demand or supply zone. These levels are the best way to determine the profit target to be expected from trade as the market takes a reversal from such points. When it comes to day trading, how intraday support and resistance should be identified?
Let’s discuss the most important aspect of intraday trading and book maximum profit in the market.
Support And Resistance For Intraday Trading
Support and Resistance levels are crucial points for traders to enter and exit from a trade.
These levels are only indicative of a market reversal, not a guarantee so use them in combination with different types of technical indicators.
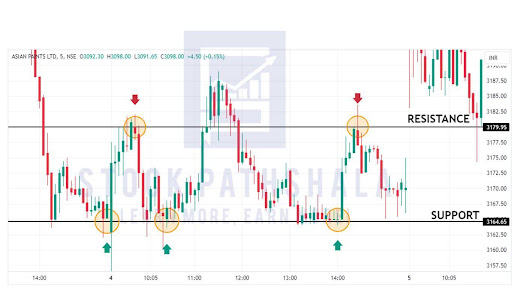
Support:
- This price point attracts the maximum amount of buying in the market as buyers take the market upwards from this point.
- This price point can act as a target price for traders who entered into a short position from the resistance level.
- It is placed below the current market price.
Resistance:
- This price level initiates large selling in the market as being a supply zone, sellers take the market downward from here through excessive selling.
- It acts as a target price for traders who have entered into a long position from the support level.
- It is placed above the current market price.
How to Find Support And Resistance In Intraday Trading?
Now, the meaning and application of support and resistance is clear and well understood, but
- What is the right time to draw this level?
- Which time frame is best for support and resistance?
- How to identify the correct support and resistance level?
Let’s get into the details step-by-step:
Load 5 Days Data
We will need a broader period of historical data to plot these levels. The more times the price takes reversal from a level the more reliable is the level.
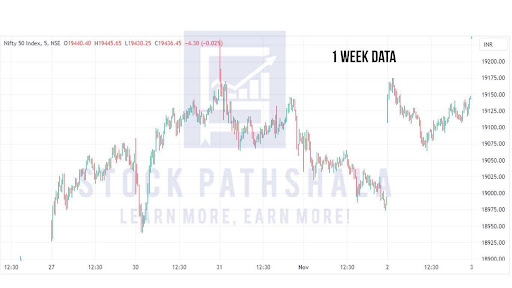 After plotting the more reliable levels of support and resistance, switch the chart to a 5-minute or 15-minute time frame for plotting levels for intraday.
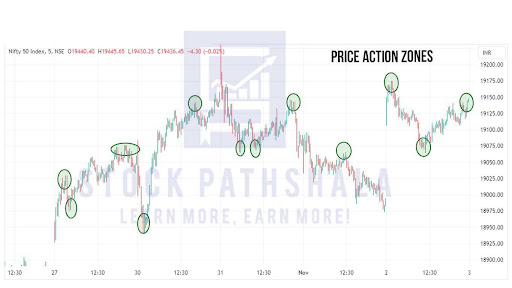
Identify Price Action Zones
Using the price action trading strategy to identify the price action zones can help depict where the price of the asset behaves peculiarly and shows some symptoms like :
(a)Hesitation to move upward: The price at which buyers start booking their profits.
(b)Hesitation to move downward: The level at which buyers’ demand increases.
(c) Taking sharp reversals: The level from which the price of the asset takes sharp reversals and moves in the opposite way from the previous price movement direction.
Align the Price Action Zone
Pick out the earlier identified price action zones that depict peculiar behavior near the same price level.
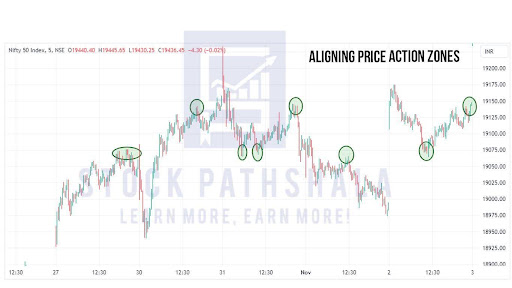
Fit a horizontal line
The last step to make a perfect trade-worthy support and resistance level is to draw a horizontal line connecting those price action zones.
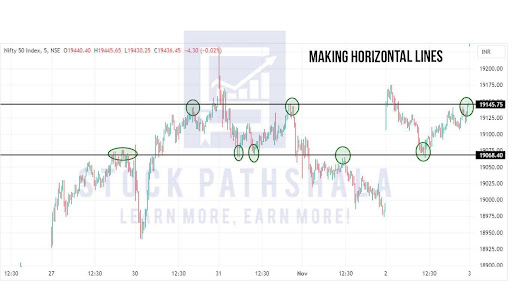
It does not need to completely connect all the zones. Based on where the line resides, it acts accordingly as support or resistance.
How to Draw Support and Resistance with Fibonacci?
Although the steps to draw support and resistance level are a bit easy if you are still finding it difficult, then here is the best way to draw it mechanically.
Fibonacci Retracement makes use of the Fibonacci series to identify supply and demand levels in the share market.
The key ratios of this tool [ 23.6%; 38.2%; 50%; 61.8%; 100% ]. These ratios are formed at certain levels that indicate possible locations of support and resistance.
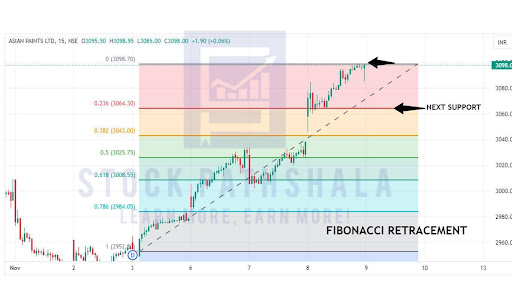
Here the golden number is 0.61 where if the price takes a support or resistance it makes a sharp move in the respective direction.
Other than this, other Fibonacci ratios also play a vital role. For example, If we see in the above picture, if the price falls from 3098, we can expect the next support at 23.6% level at 3064 rupees. These levels help the intraday trader in setting stop loss and targets for their trades besides acting as support and resistance levels.
Intraday Support and Resistance Strategy
Now we know how to find support and resistance in the market, let’s put it to some use to make profits. We have 2 situations after plotting the support and resistance levels.
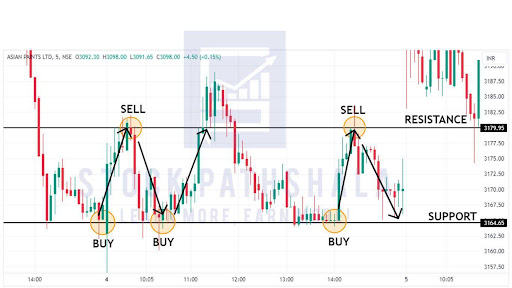
Entering a Long Position
The trader can enter into a long position when the market hits the support level. This is the demand zone that can initiate the buying in the market. But beware of breakouts.
- Support breakout: If the market falls below a support level, it shows that bears have pressurized the market and the price of the asset falls deeper. If you put a stop loss in your long trade you should be safe.
- Breakout failure: Sometimes the market makes a quick reversal after breaking support. This is a false breakout to trap the sellers in the market. After this market goes upward by taking help from the support level.
Entering a Short Position
The trader can enter into a short position if the market hits a resistance level. Place your target and stop loss adequately for risk management. These levels act as supply zones and traders do profit booking here which brings the market down. Here also we see some breakouts.
- Resistance Breakout: When the buyers in the market pressurize the prices to go up, the market breaks resistance levels. This tells us that bulls have sustained in the market.
- Breakout Failure: At times the market makes a quick reversal after giving a breakout from resistance levels. This false breakout traps the buyers and the market gives a down move by taking rejection from resistance levels.
Conclusion
Support and resistance provide a trader with definitive entry and exit points. Although the interpretation is personally biased, these levels are the psychological anchors to whom the market reacts. And they can help frame a robust intraday trading strategy to earn good profit.
For some traders, these are the sole indicators of the coming move in the market, whereas the majority of traders use them in combination with Technical indicators like RSI, EMA and Bollinger bands to get a better confirmation of the price movement.
Want to gain knowledge about the stock market concepts? Spare a few seconds to fill in your basic contact details in the form below.
Before investing capital, invest your time in learning Stock Market.
Fill in the basic details below and a callback will be arranged for more information: