

Moving averages are one of the most commonly used technical tools, also known as trend-following or lagging indicators. The reason for their popularity is the core advantages of moving average calculations, which help in filtering out random market “noise” to reveal the true direction of a stock.
But is moving average a good indicator?
Let’s try to answer this question. Moving averages is just a common word for different averages and they can be classified into two further categories called Simple Moving averages and Exponential Moving Average.
By carefully weighing the merits and demerits of moving average method, you can effectively clear the air on whether this indicator fits your personal trading strategy.
In case you are puzzled about whether you should use moving averages or not so let’s clear the air
What is Moving Average?
Moving average is the technical indicator that helps a trader in determining the trend of a particular stock. It is the simplest indicator that uses the closing price data to analyze the current trend and momentum of the market.
As discussed, it is of two types, Simple Moving Average and Exponential Moving Average. The former is the one that calculates the average of the particular days or periods while the latter puts more emphasis on the latest data and is hence more accurate.
Let’s understand this in detail. Suppose you are looking at the daily chart, where the closing price of the stock a week before (let’s say Friday) is ₹100 and today it is ₹110, here the percentage change in closing price as per SMA is 10%.
But EMA considers the latest data and as time moves forward it eliminates the previous data and calculates the average on the basis of the latest price change hence here the EMA will be calculated considering the closing price of Monday. Let’s say it is ₹102, hence the change in closing price would be 7.7%.
In this way, one can do the moving average calculation and analyze the market and change in stock price over the range of a specific time period using the SMA and EMA indicators.
For better understanding, you can refer to SMA vs EMA
Simple to use and understand, this technical indicator is opted by many traders but is moving average a good indicator? Can a beginner trader completely rely on this for technical analysis of stocks?
Well! every trader has its own strategy and techniques for using an indicator, so there could be a situation where it works for one while failing for the other.
But to come up with a general observation, there are a few things that one must consider while using this indicator and futher analyze the pros and cons associated with it to determine is moving average a good indicator.
Moving Average Uses
As discussed above, the Moving average is used to analyze the trend and momentum of the market. The price trending above the moving average line (either SMA or EMA) points towards a bullish trend and vice versa. Thus, these indicators are helpful in taking a position for intraday and swing trading.
You can increase the sensitivity of the information and data by relying on the EMA indicator and further improve accuracy by using 20 and 50 EMA crossover.
Apart from this, the indicator acts as support and resistance and is thus helpful in determining the trend reversal to some extent.
They provide excellent buy and sell signals for intraday as well as for swing trading. Also, traders can use moving averages to find support and resistance
Let’s show you how a simple moving average can be used to find support and resistance levels in a trading chart.
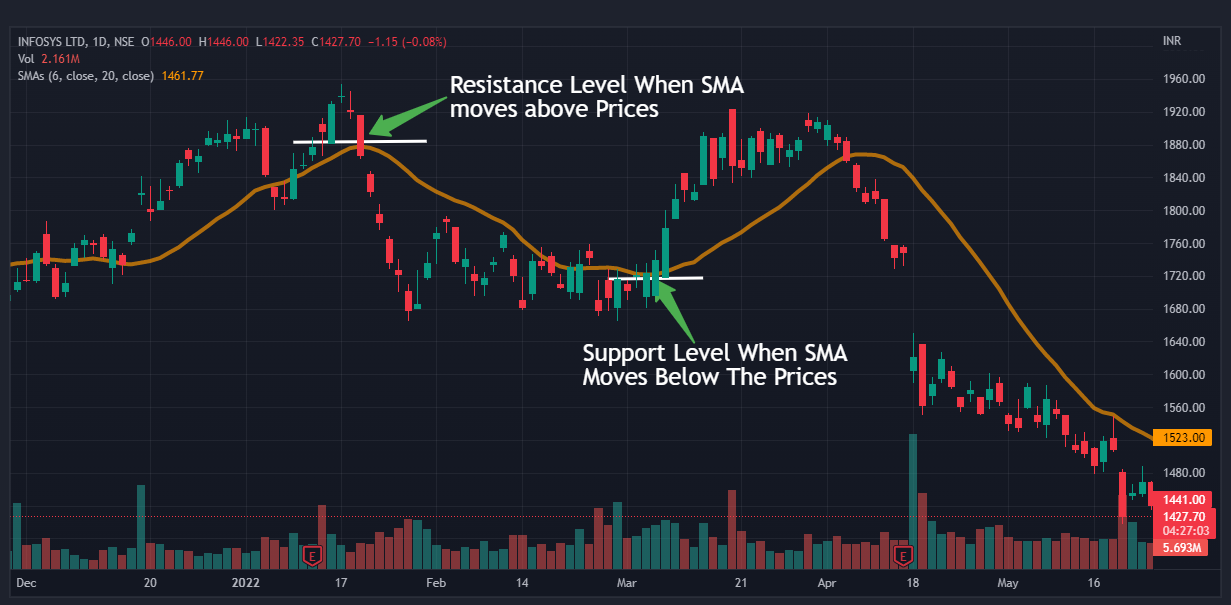
Here we have taken the price chart of Infosys LTD. Here as you see resistance and support levels are highlighted by white and red horizontal bars.
The rule of thumb is if 20-period SMA lines move above the prices it will act as a resistance level. If the SMA line moves below the prices it will act as a support.
You can use a single moving average to find out the best trading spots in case you are not satisfied with a single moving average, you can use a crossover of two short-term and long-term moving averages to determine the exact entry and exit trading points.
For example, you can use a 5-day simple moving average with a 15-day moving average on a 15-30 minute trading chart. Also, you can use the exponential moving average crossover, which uses more recent price data to derive trends, for obtaining accurate trading signals.
Here is the depiction of how crossovers work on a price chart.

Here in the chart, in a white circle, you can see that the 21-period moving average, indicated by the purple line is crossing above the 9-period moving average shown by the yellow line indicating a bearish trend which is confirmed by the formation of red candles.
Now, look at the red circle. Here you can see that the 9-period moving average is crossing above the 21-period moving average which means that from here share prices will rise, indicating a bullish trend which is confirmed by the formation of bullish or green candles.
In this way, you can use the moving average crossover to find out trends in the market.
Both SMA and EMA behave in a similar fashion when applied to charts so you don’t need to learn anything different for using them. This flexibility makes them one of the best technical indicators for trading.
But one thing that should be kept in mind while working with SMA and EMA is that EMA reacts to prices quickly that is why it is a better indicator for short-term trades while SMA reacts with some lag to price it is considered for long-term trades.
Disadvantages of Moving Average
To conclude is moving average a good intraday trading indicator it is important to consider some of the drawbacks as well.
- First, they are lagging indicators as they generate trading signals by using historical prices.
- The second reason is that moving average can produce false signals if period settings are not chosen carefully.
- A third reason can be attributed to the volatile market because in a volatile market frequent crossovers occur which can misguide or confuse a trader.
- The period chosen for trading in one stock to determine support and resistance level might not work in other stock. For example, there might be a case where a 50-period moving average can help in finding the support and resistance in Infosys but not in TCS. This makes it a little difficult for a beginner trader to understand how to use and set the indicator to get accurate results.
- Last but not the least, the moving average gives an idea of the current trend but cannot be used to determine the future market movements.
To avoid such situations, it is always recommended to use a combination of indicators that makes it easier for traders to take the right position depending on different market conditions.
Conclusion
While trading or investing in the stock market, we should always remember that nothing is perfect in this world. Neither are moving averages. They have their pros and cons too. But they can be effectively optimized by using other technical indicators in combination.
The problem is that false signals are common in volatile markets, which can cause losses in trading. So it is advised to take a course which will give you throughout knowledge of technical indicators, their use, advantages, and disadvantages.
If you are looking for the best yet most affordable technical analysis course you can subscribe to our official Stock Pathshala stock trading course.
In case you’d like us to call you back to explain more about stock market learning, just leave your contact info below:
Before investing capital, invest your time in learning Stock Market.
Fill in the basic details below and a callback will be arranged for more information:


