To begin trading in options it is important to gain an understanding of the options chain, but what does the option chain indicate?
It gives an idea of the liquidity, volatility, and trend of underlying assets and eventually helps a trader in taking the right position. In this article know how to read the options chain and what each parameter indicates in detail.
What is Option Chain?
The option chain is a comprehensive listing of all option contracts available for a particular asset. It shows a table of various strike prices, and expiration dates linked with the call and put options. Option chains make it easier for options traders to understand the difference between call option and put option and also to compare different types of options strike prices in a single view.
In simple terms, it is the chart with the detail of the liquidity, volatility, value, and open positions in the market. Reading option chain data further simplify the journey of the options trader by providing real-time information and the change in the value of the premium in the long term.
Let’s get a deeper understanding and know what the option chain indicates.
Option Chain Explained
Here is what the option chain looks like:
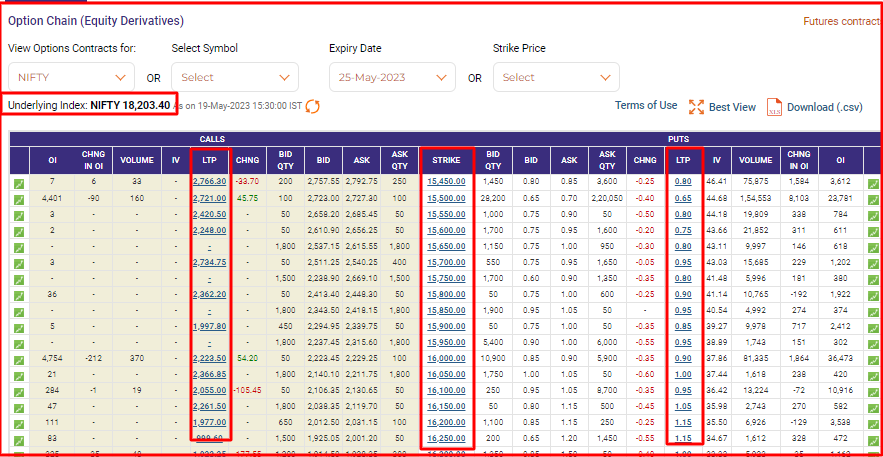
As shown in the above image, there are the following parameters in the option chain:
- Spot Price
- Strike Price
- Expiry
- LTP
- Change in LTP
- Bid/Ask Price
- OI
- Change in OI
- Volume
Spot Price and Strike Price
It indicates the current market value of the underlying asset. For example, in the above option, chain 18,203 is the spot value of Nifty. On the other hand, the center column is the strike price, which indicates the value at which option buyer is obligated to buy or sell the underlying asset on expiry.
Expiry Date
The date that the buyer chooses to settle the trade with the option seller is called the expiry date. For indexes like Nifty and Bank Nifty, there are options for weekly as well as monthly expiry.
On the other hand, for stock options, there is only an option of monthly expiry.
What is LTP in Options?
These two columns on the left and right side provide the detail of premium value corresponding to the strike price for the call and put option respectively. Here if you are looking to start option trading with 1000 rupees then you can choose the strike price with low premium value.
Change in LTP further helps a trader in analyzing the market. For example, if the change is positive for the call option (left side) then it indicates a bullish market while a positive change in premium for the put option gives a bearish indication of a market trend.
However, if the market shows the same signal (positive or negative) change in LTP on both sides, then this indicates a neutral or sideways market condition.
What does Open Interest Indicate?
OI i.e. open interest on the extreme left and right side of the option chain indicates the number of open positions in the market. The open interest data alone does not help in determining the market movement.
However, when a change in OI is studied in relation to a change in LTP, it tells about the aggressiveness of the trader (buyer or seller) for a particular strike price.
The following table helps you determine a change in OI in relation to option premium value:
Change in Open Interest in Relation to LTP OI Value Change in LTP Trade Position Increases Positive Long Buildups Increases Negative Short Buildup Decreases Positive Short Covering Decreases Negative Long Unwinding
Now, changes in premium along with open interest provide traders the detailed understanding of market sentiments and to understand long build up vs short build up.
What is Volume in Options?
Volume helps in determining the liquidity of the particular option contract. Also, a change in volume in relation to a change in premium helps in determining market trends.
Change in Volume in Relation to Price Volume Change in LTP Trend Increases Positive Bullish Increases Negative Bearish Decreases Positive End of Bullish Trend Decreases Negative End of Bearish Trend
IV in Option Chain
IV represents implied volatility that gives an understanding of the range in which the price can increase and decrease from the current value. High IV indicates high swings and vice versa.
Any news, events, or announcements increases the IV value that directly increases the premium value of call-and-put options.
Bid and Ask Qty
Bid and Ask Quantity help in identifying the demand and supply of the asset as it tells the number of buy orders and sell orders for a particular strike price.
Bid Price and Ask Price
The bid and Ask Price shows the worth quoted within the last buy and sell order. If there is a price above the LTP then it may indicate that the demand is rising.
Option Greeks
Apart from the NSE option chain, there are advanced option chains with more details like Option Greeks. These greeks are the financial metrics that help in determining the price movement of the option contract.
There are four different options greeks: Delta, Theta, Vega and Gamma
All these Greeks help in determining the trend, change in premium, and time value of the option contract. Here is the details of these Greeks.
Delta
This Options Greek represents the rate at which the price of an option changes in relation to the price movement of the underlying asset. For example; if the underlying asset’s price changes by Rs.1, the option price will change by Rs.0.2 when the delta of the option Greek is 0.2.
The delta value typically falls within the range of -1 to 1. For call options, the delta ranges from 0 to 1, while for put options, it ranges from -1 to 0. When an option is “In-the-Money” (when the spot price is greater than the strike price for call options or the strike price is greater than the spot price for put options), the delta value approaches 1 for call options or -1 for put options.
Another way to understand delta is that it helps determine the likelihood of an option expiring In-the-Money. So, in case the delta is 0.2 this means, that there is a 20% probability of the option expiring in the money.
Theta
Options value decreases as the expiration date approaches. This is called time decay in options, and it is governed by theta.
Theta is typically negative for options because each option has an expiry day on which the premium paid by buyers becomes zero if the option expires Out-of-the-Money.
This benefits the option seller who shorts their position and earns profit with the declining premium value with each passing day. To begin option selling know how option selling works.
Vega
Vega is an option Greek that measures the change in an option’s price concerning changes in implied volatility. If the volatility of the asset increases or decreases by a certain percentage, the option price will increase or decrease by the vega amount. Vega and option values are directly proportional, meaning that an increase in vega will increase the option value, and vice versa.
Vega is important for traders as option premiums tend to rise with increasing volatility.
Gamma
Delta value changes with the change in spot value but at the same time, Delta also changes as the option moves in or out of the money.
To determine the change in Delta, there is another Option Greek called Gamma that works as a second-degree order and measures the change in delta value.
Long options, whether call or put, have a positive gamma and it is highest when the option is at-the-money (when the strike price equals the spot price), but it decreases when the option is deep in-the-money or out-of-the-money.
Now to begin options trading it is important to gain an understanding of all these concepts. So, if you are serious to learn to trade then you can opt for option trading mentorship in which you get personalized guidance and strategies as per your risk appetite and capital.
How to Read Option Chain?
Now the above data helps in analyzing the direction, liquidity, and number of active open positions in the market.
A trader can use this data along with the price action or indicators to take the right position. Also, the option chain provides data on PCR also called Put Call Ratio.
PCR in option chain helps in determining the overall market sentiments.
It is the ratio of the total OI value of the Put Option and the OI value of the Call option. Now, OI generally provides information of the option seller hence PCR value of more than 1 indicates a bullish market while a PCR value of less than 1 indicates bearish market sentiments.
Let’s take an example;
Suppose you are using the put-call ratio to find out market conditions.
Here given number of puts initiated is 1500
The number of calls initiated is 1800
Then PCR will be
=Total Put OI/ Total Call OI
i.e. 1500/1800 = 0.8
As it is less than 1, this implies that there are more put option sellers than call options which indicates a bearish market.
Analyzing the put-call ratio is an essential tool for understanding market sentiment and making informed trading decisions. Put options are commonly used to hedge against market weaknesses or speculate on market declines, while call options are employed to hedge against market strengths or bet on market advances.
However, it’s important to note that the put-call ratio has its limitations and drawbacks. Investors should thoroughly understand these limitations to effectively navigate market sentiment uncertainties.
It is therefore recommended to use PCR data along with other data and price action strategies or indicators.
Conclusion
If you are a beginner and want to know how to do option trading then an option chain is a very powerful tool that can help you with valuable insights into the derivatives market. By learning option chains, traders and investors can gain a competitive edge and make well-informed decisions.
But always remember that options trading involves risks, and it’s important to conduct thorough research, seek professional advice, and practice prudent risk management. To start a deep learning of Options, you can enroll in Stock market courses by StockPatshala and explore option chains as well.
In case you’d like us to call you back to explain more about stock market learning, just leave your contact info below:
Before investing capital, invest your time in learning Stock Market.
Fill in the basic details below and a callback will be arranged for more information: